Главная UXMagic
  • English
  • Español
  • हिन्दी
  • Bahasa Indonesia
  • Tiếng Việt
  • Português
  • Русский
  • 中文
  • العربية
  • Deutsch
  • Français
  • Возможности
  • Библиотеки
  • Шаблоны
  • Тарифы
  • Партнёрам
  • Ресурсы
Главная UXMagic
  • English
  • Español
  • हिन्दी
  • Bahasa Indonesia
  • Tiếng Việt
  • Português
  • Русский
  • 中文
  • العربية
  • Deutsch
  • Français
Главная UXMagic

Библиотеки

ШаблоныНовое
Фреймы сообщества
Тарифы
Партнёрам

Ресурсы

Мы в соцсетях:
  • Подписывайтесь на нас в Slack
  • Подписывайтесь на нас в Twitter
  • Подписывайтесь на нас в LinkedIn
  • Подписывайтесь на нас в YouTube
  • Подписывайтесь на нас в Instagram
  1. Templates
  2. /
  3. Education
  4. /
  5. Energy Grid Data Story Template
Full screen
Loading the design…

Energy Grid Data Story Template

Nothing Is Stored — The Grid — one day on an electrical grid

A scroll-driven explainer about the fact that electricity is not stored: it is made in the instant it is used. The page follows one day on a grid through balance, inertia, the response stack and the moments the system is tested.

Free to browse and preview. Starting a project from a template needs a paid plan.

Or make it yours as it opens

Leave blank to start from the design as it is

About this template

This is the most quantitative page in the library and the best model for a data story where the numbers are the point. It never shows a chart without first explaining what would make the line move, which is the difference between a dashboard and an explanation.

It is also proof that an infrastructure subject does not have to look like a utility brochure. The typography and the pacing are editorial; the content is engineering. That combination is what most technical companies are actually looking for.

What's included (9)

  1. 1Hud
  2. 2There is no battery. It is being made right now.
  3. 3Every generator on the system is one machine, turning together
  4. 4The whole reserve is the weight of the spinning parts
  5. 5A stack of responses, arranged by how fast they can arrive
  6. 6The largest surge on record was caused by a penalty shoot-out
  7. 7Four numbers off the wall of a control room
  8. 8In 2018 the clocks in Europe went slow.
  9. 9Footer

Design system

Palette

  • --ink: #eff3f8
  • --ink-2: #c0cad8
  • --ink-3: #8590a1
  • --line: rgba(206, 220, 240, 0.13)
  • --line-2: rgba(206, 220, 240, 0.27)

Typefaces

  • IBM Plex Sans
  • IBM Plex Mono
  • Inter

Who it's for

  • Energy utilities, grid operators and regulators
  • Cleantech and storage companies explaining the problem they solve
  • Data journalism on infrastructure and supply
  • Technical companies that need an editorial explainer

Specification

Layout
1440px wide
Page length
7,700px
Sections
9
Colour scheme
Dark
Typefaces
3
  • Scroll-driven — the page responds as you move down it
  • Live WebGL graphics, rendered in the browser
  • No photography — everything is drawn in code, so it stays sharp

How to use this template

  1. 1

    Look through the design

    Scroll the live preview on this page. It is the real energy grid data story template running in the browser, not a screenshot, so what you see is what you get.

  2. 2

    Say what you want it to be

    Type your business, product or subject into the box, or leave it blank to start from the design exactly as it is. Starting a project from a template is a paid-plan feature; looking through them is not.

  3. 3

    Let it be rebuilt around you

    The copy, the palette and the imagery are rewritten for your subject while the layout, typography and motion of the original are kept.

  4. 4

    Keep editing, then export

    Open it on the canvas to change anything by prompt or by hand, then publish it or export the code.

Questions

Are the figures real?

+

The page is built on published grid behaviour — frequency, inertia and reserve — and presents it as an explanation rather than a live feed. Replace it with your own data when you make the page yours.

Can I point it at my own dataset?

+

Yes. Describe the story your data tells and the page keeps its structure — hook, mechanism, stack, stress test, numbers, close.

Is this energy grid data story template free to use?

+

Browsing is free and needs no account — you can scroll the whole design on this page, at desktop and at mobile width, before deciding anything. Starting a project from a template is on the paid plans.

Can I change the colours and fonts?

+

Yes — every colour in this design is a named token and every typeface is declared once, so asking for your own brand rewrites a handful of declarations rather than regenerating the page. This template currently uses IBM Plex Sans, IBM Plex Mono and Inter.

Do I need an account to look at the templates?

+

No. Every template page, its live preview and all the category pages are open to anyone — no account, no sign-up wall. An account and a paid plan are needed only when you start a project from one.

Do I need to know how to design or code?

+

No. You describe what you want in plain language and the page is rebuilt around it. If you do write code, you can export the HTML and CSS and take it with you.

Can I use it for a commercial project?

+

Yes. Pages you make from a template are yours to publish and to use commercially.

More Education templates

See all education templates
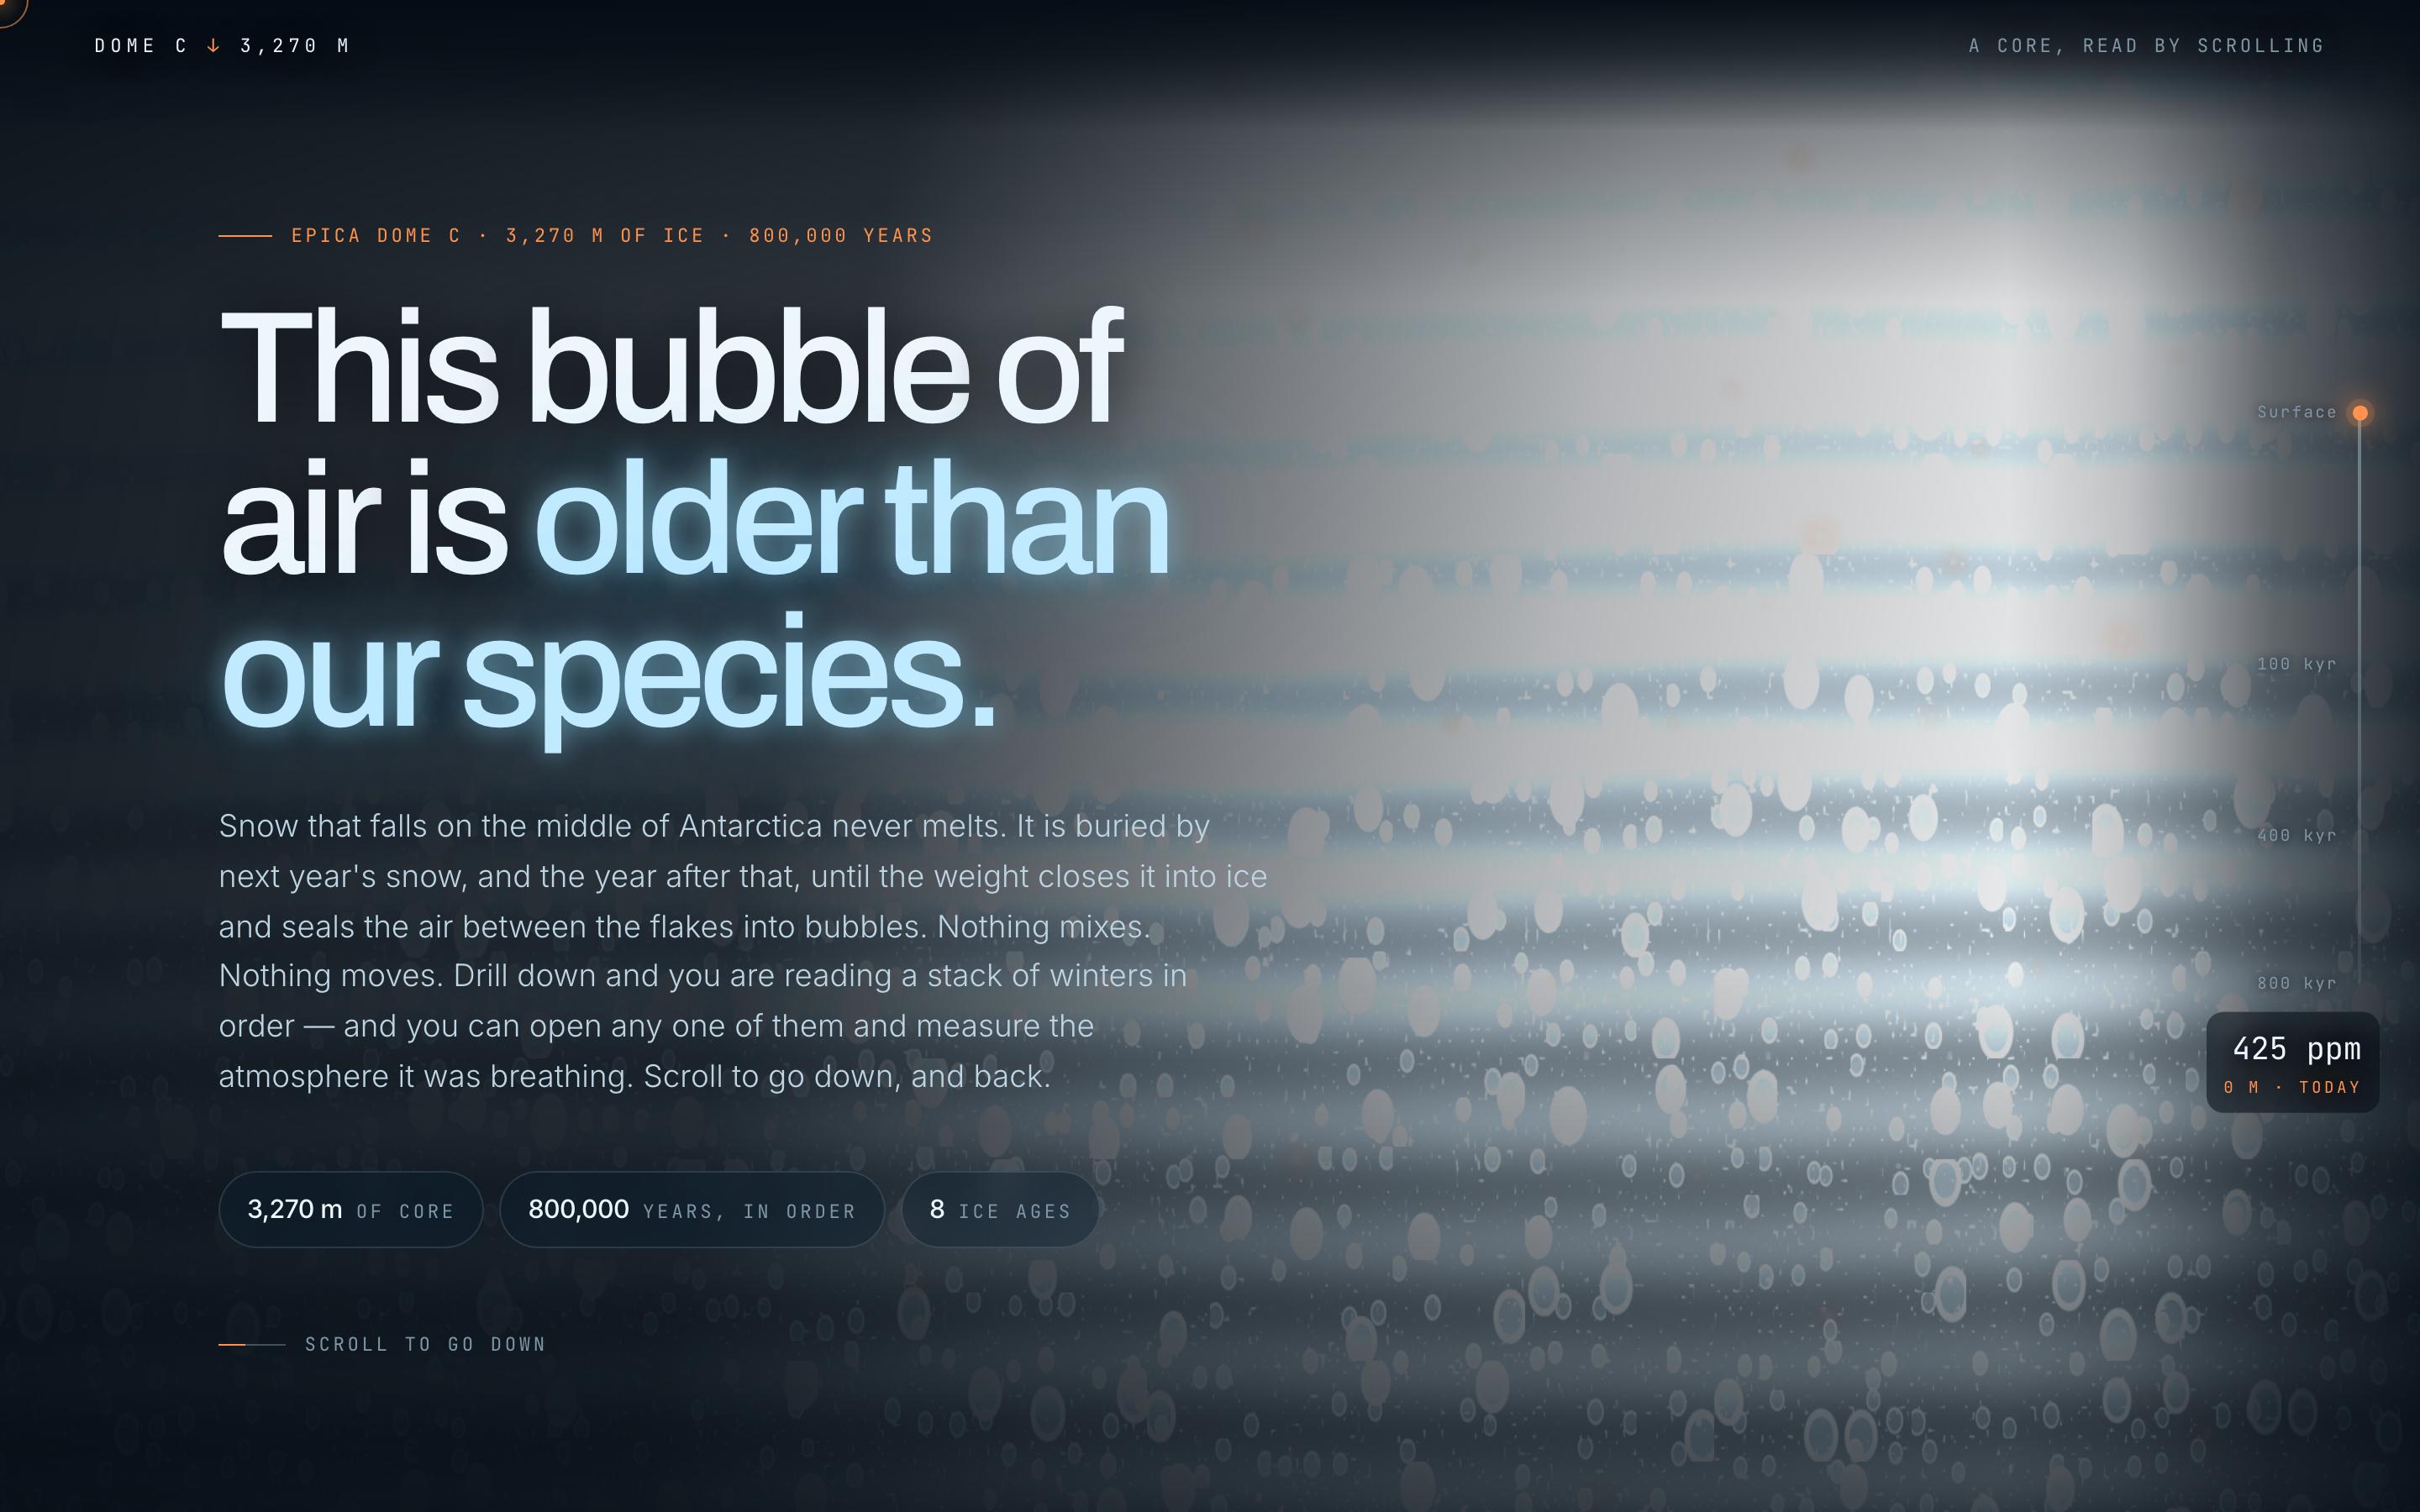
Climate Science Scrollytelling Template — preview

Climate Science Scrollytelling Template

Education

Antarctic Ice Core

This bubble of air is older than our species

CanvasWebGLScroll-driven
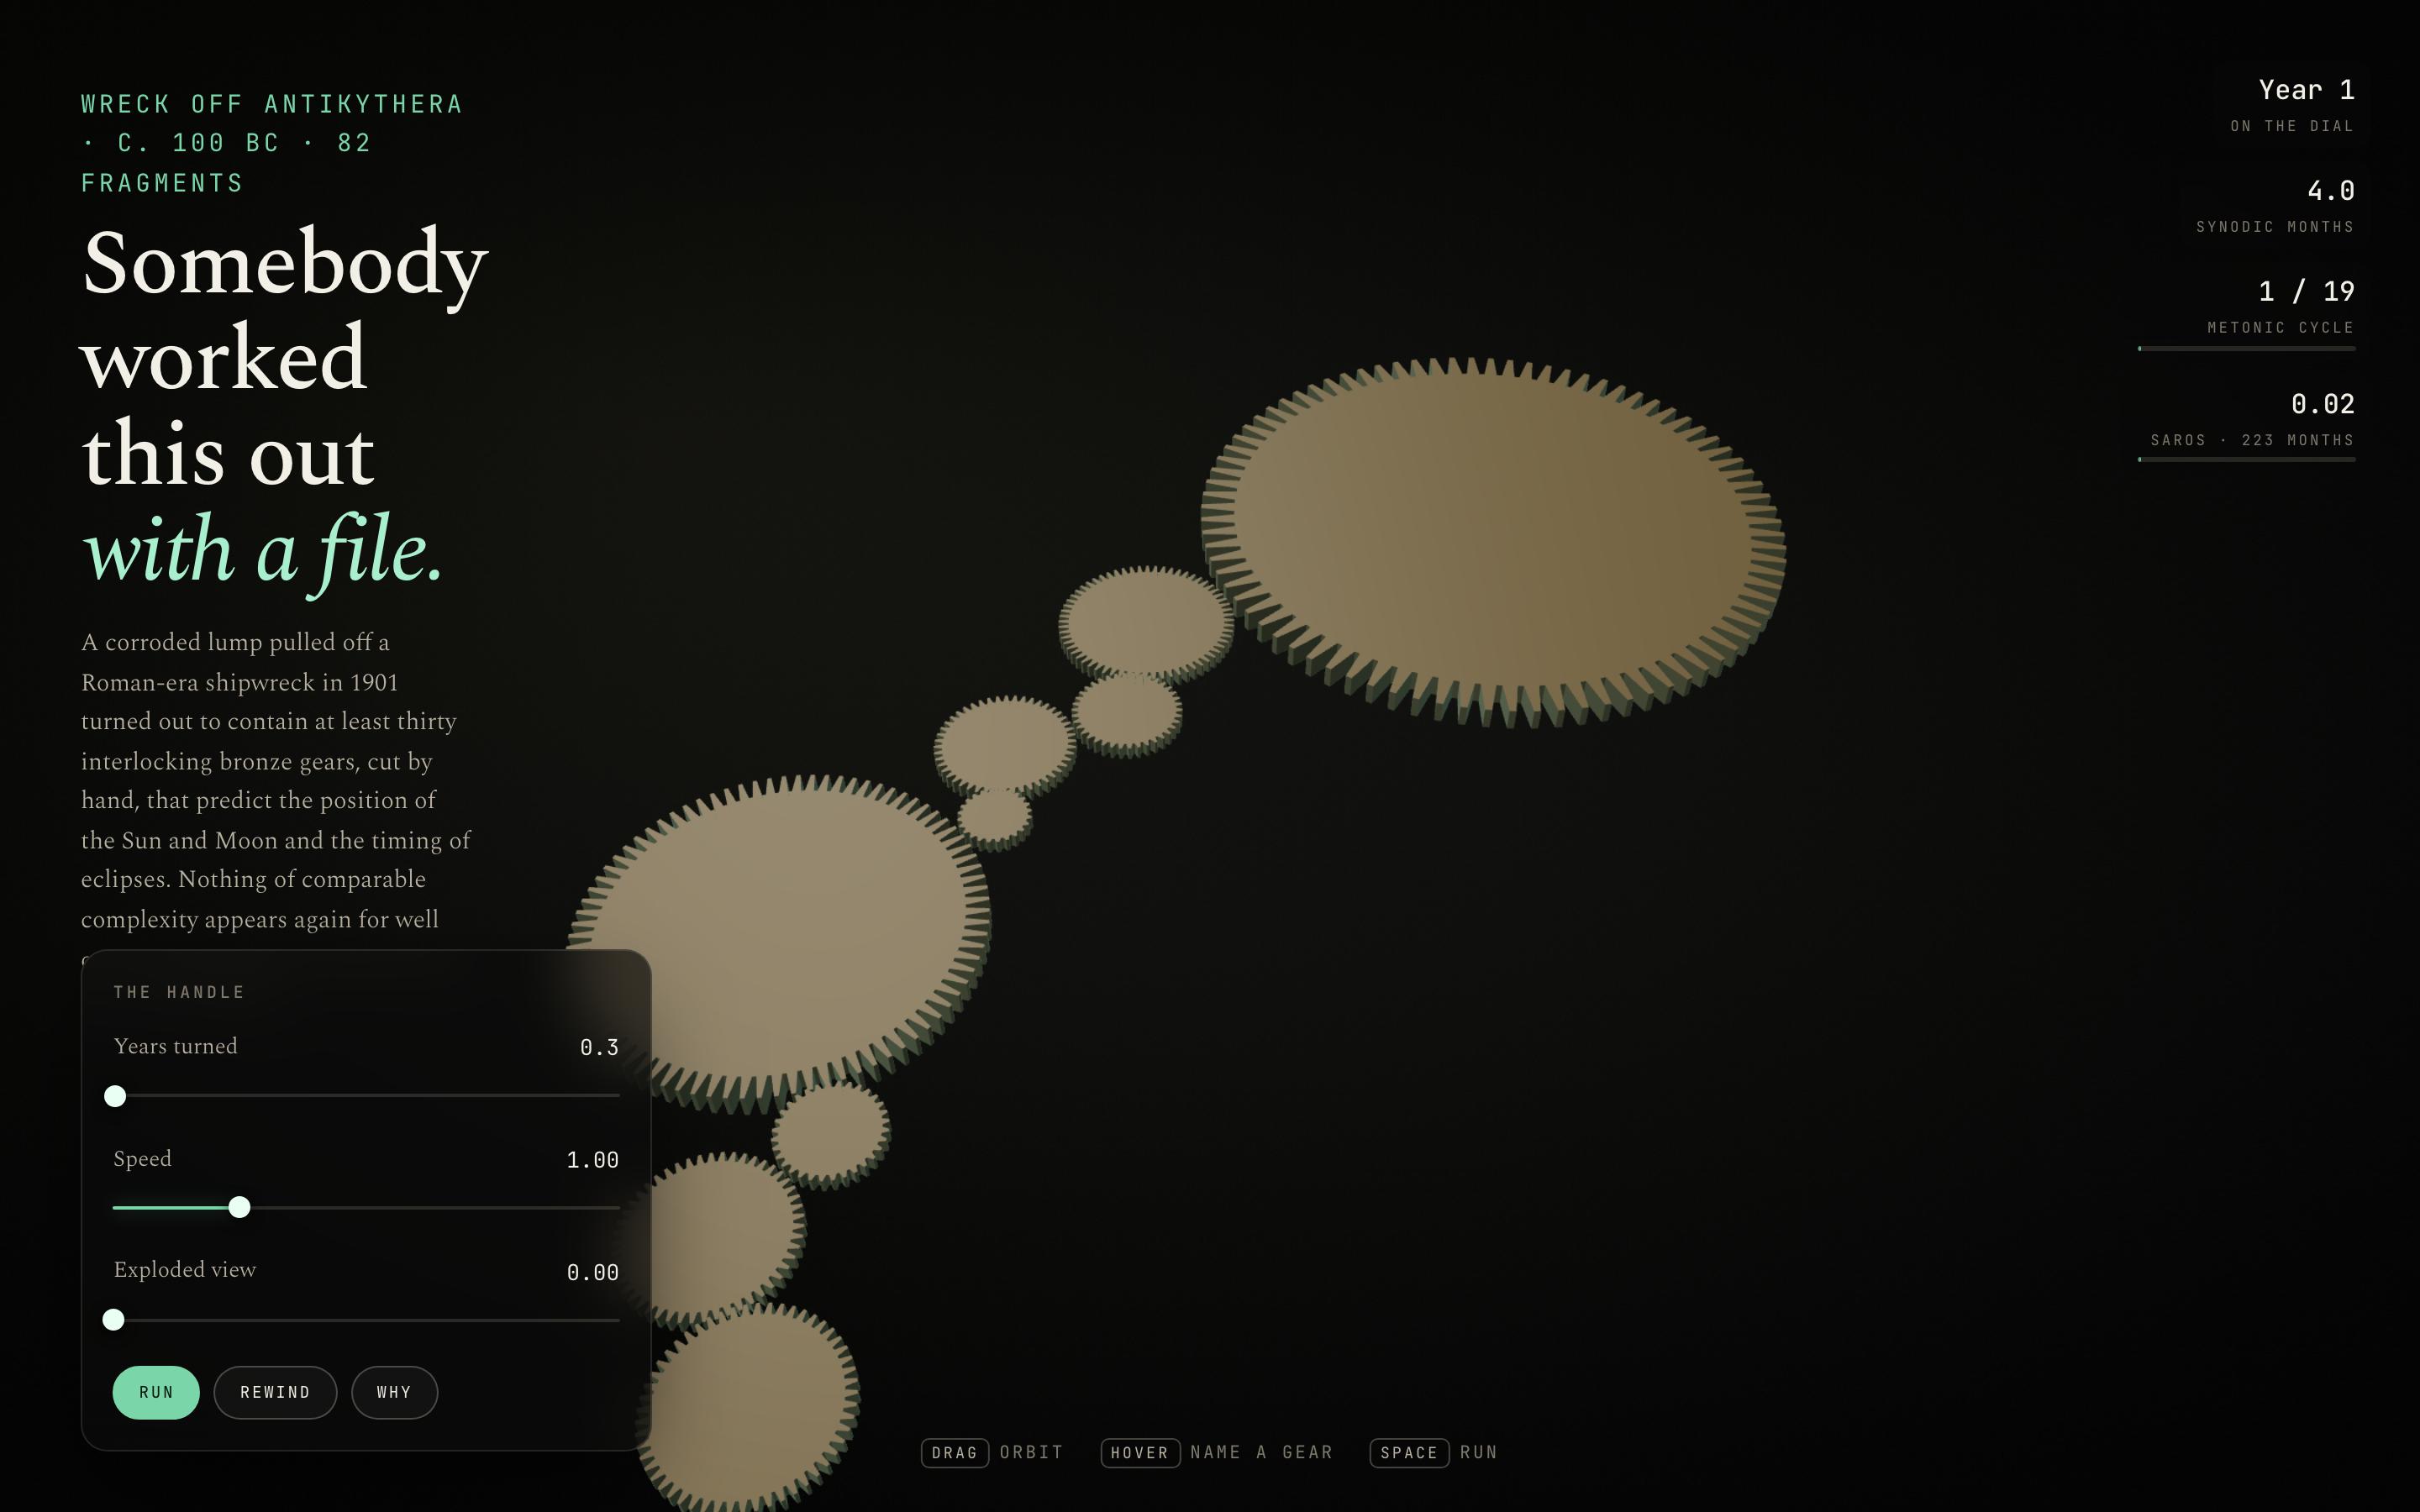
Interactive Mechanism Explainer Template — preview

Interactive Mechanism Explainer Template

Education

The Antikythera Mechanism

Somebody worked this out with a file

CanvasWebGLSingle screen
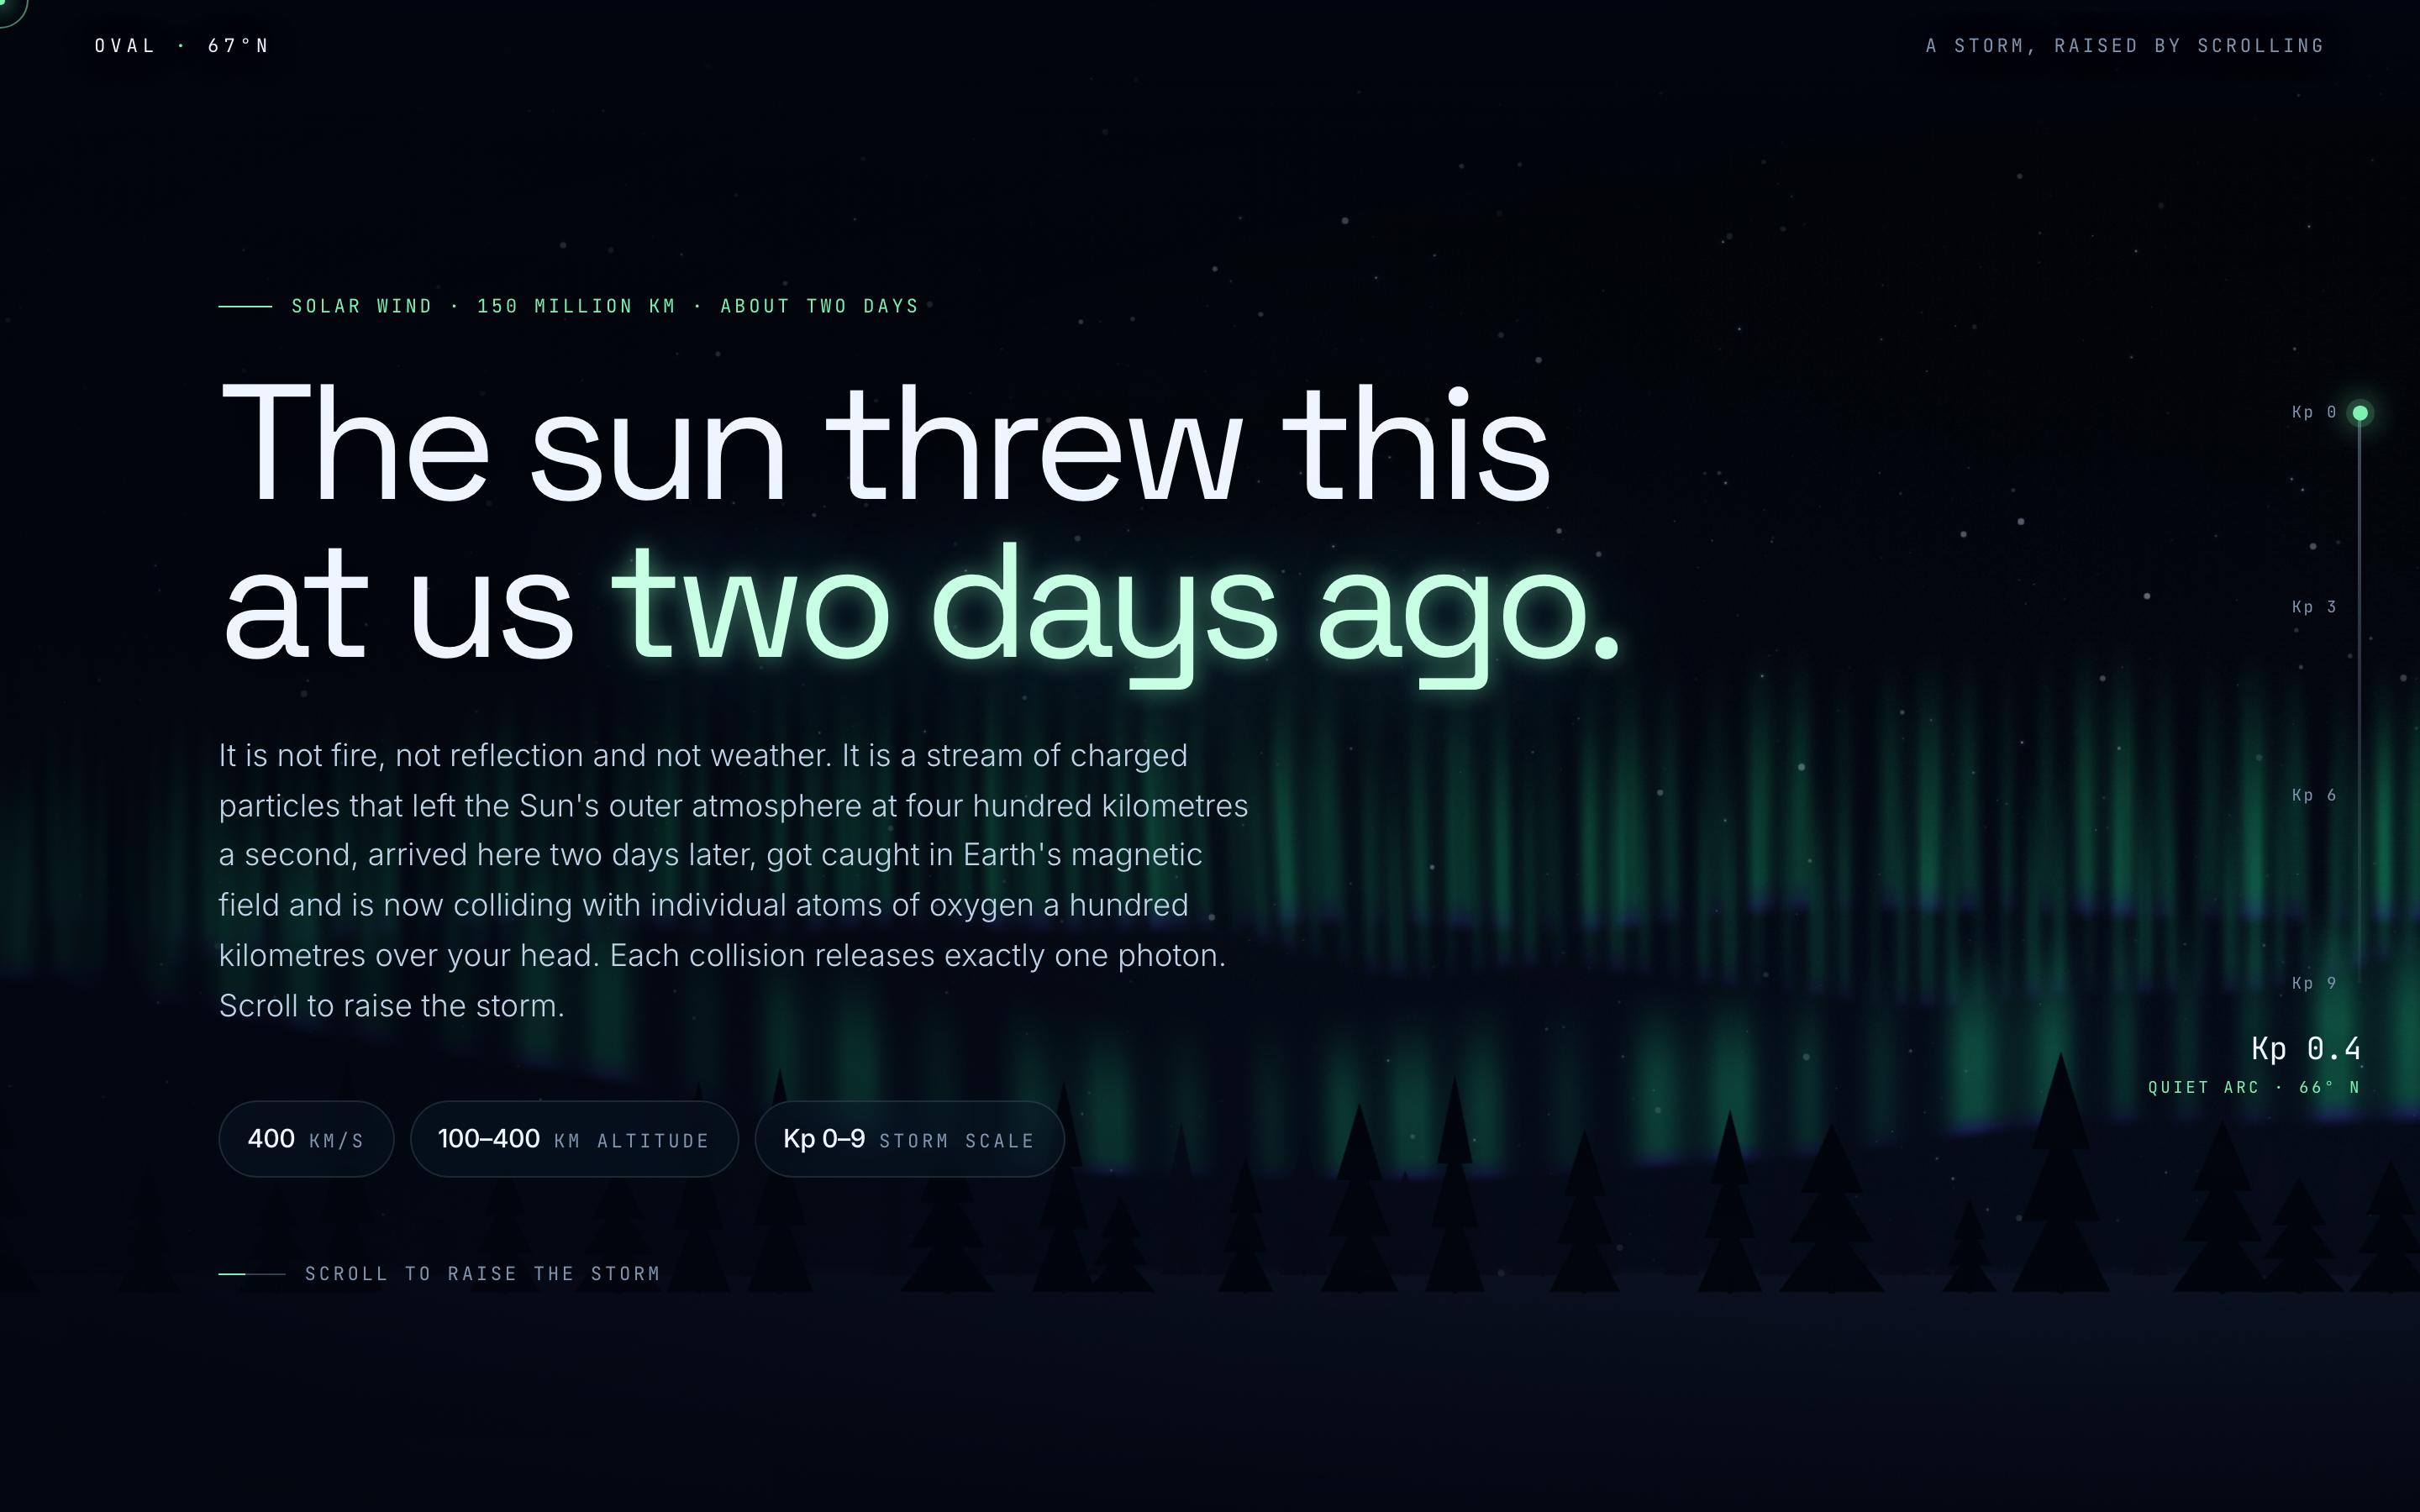
Space Weather Explainer Template — preview

Space Weather Explainer Template

Education

Aurora Borealis

The sun threw this at us two days ago

CanvasWebGLScroll-driven
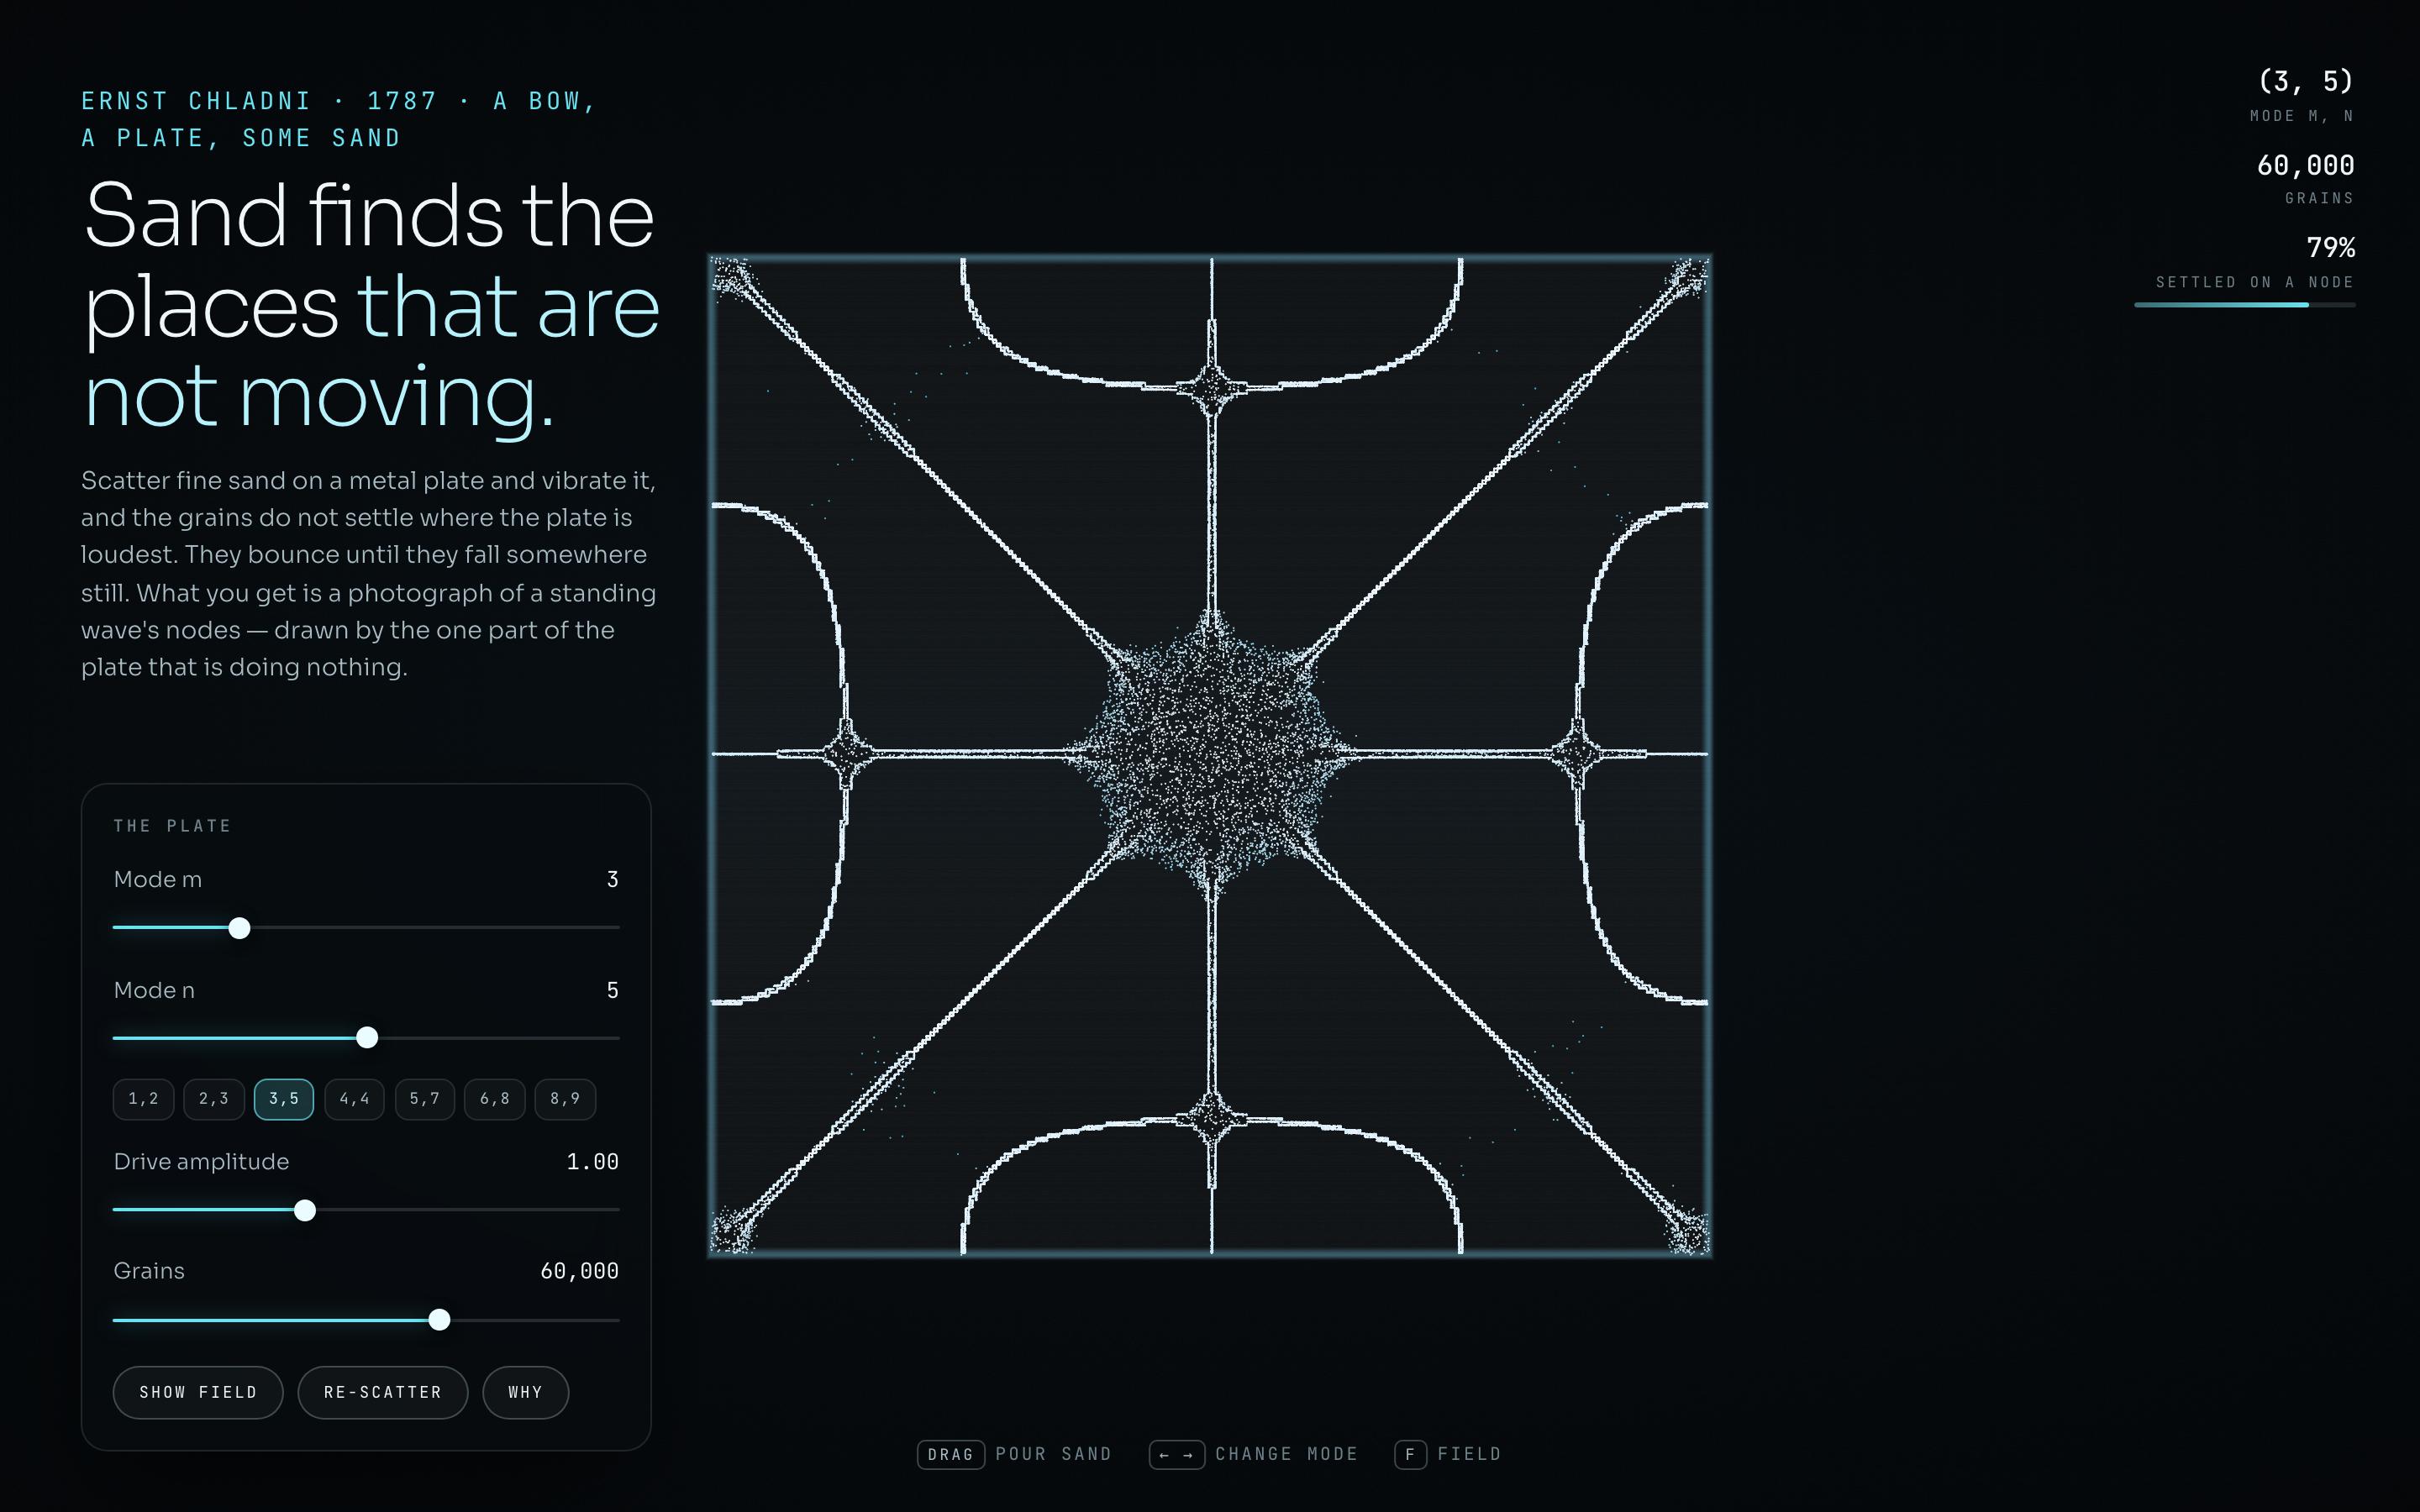
Generative Art Landing Page Template — preview

Generative Art Landing Page Template

Education

Chladni Plate

Sand finds the places that are not moving

CanvasWebGLSingle screen
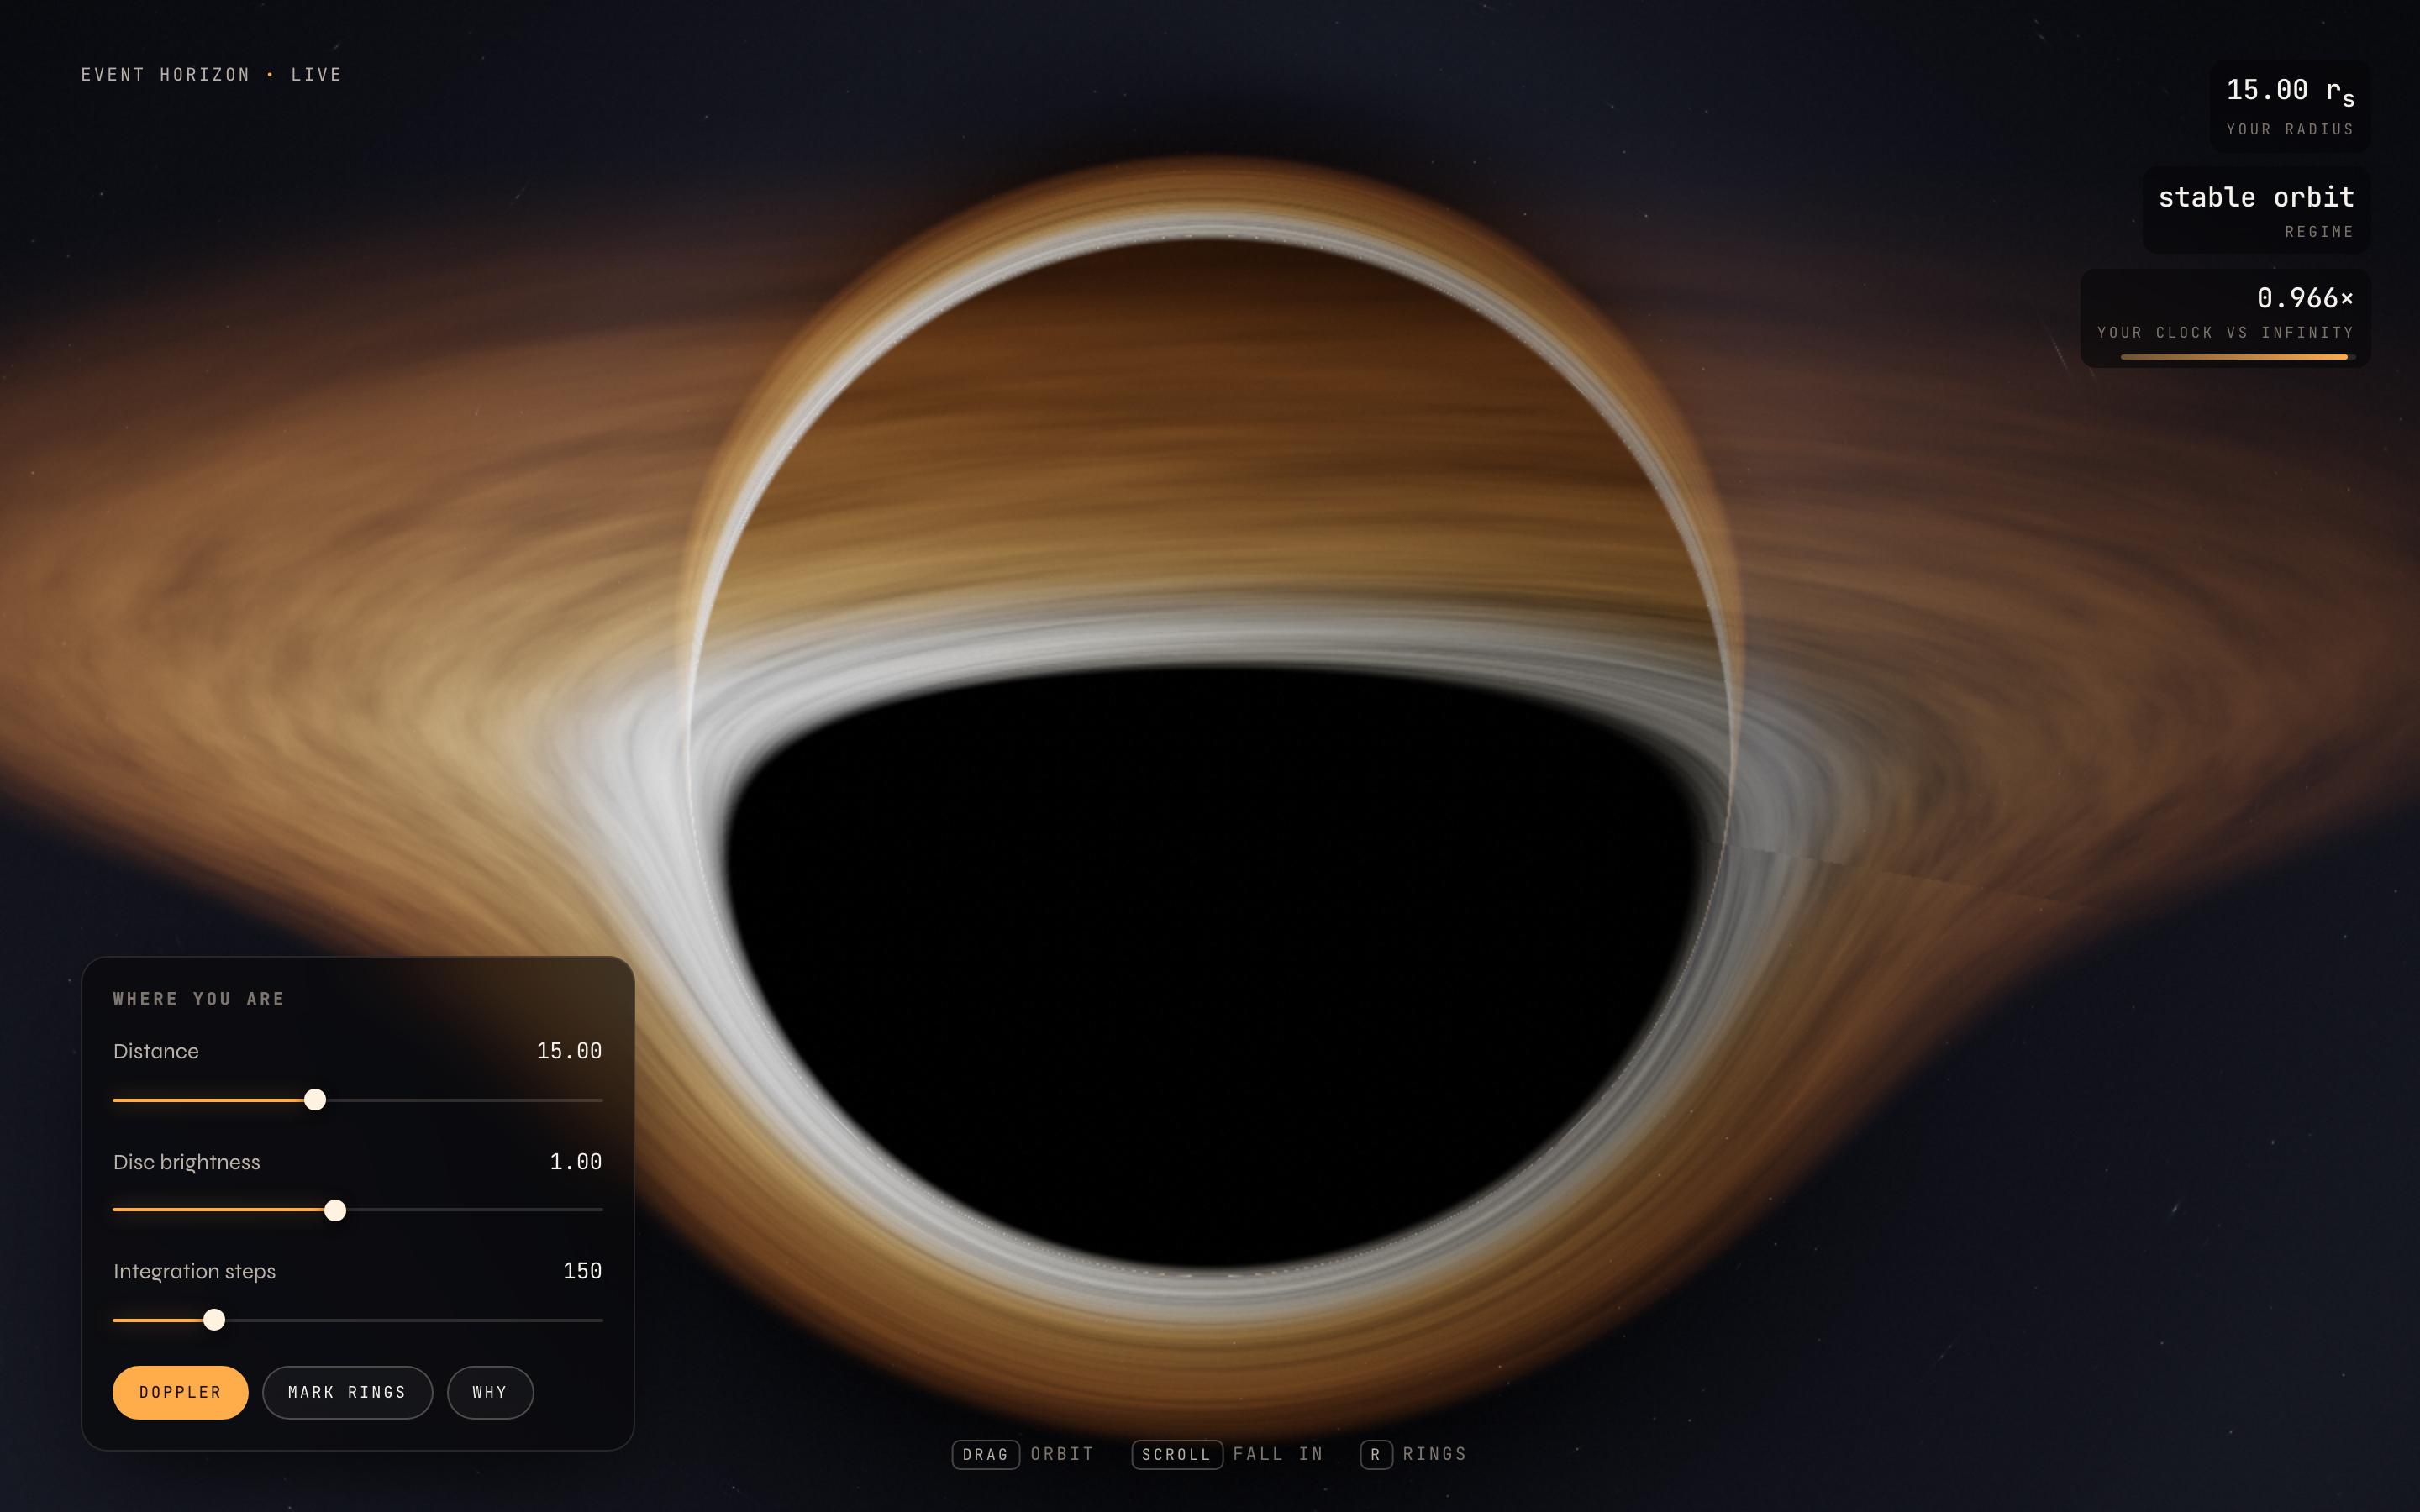
Astrophysics Visualisation Template — preview

Astrophysics Visualisation Template

Education

Event Horizon

photons bending around a black hole

CanvasWebGLSingle screen
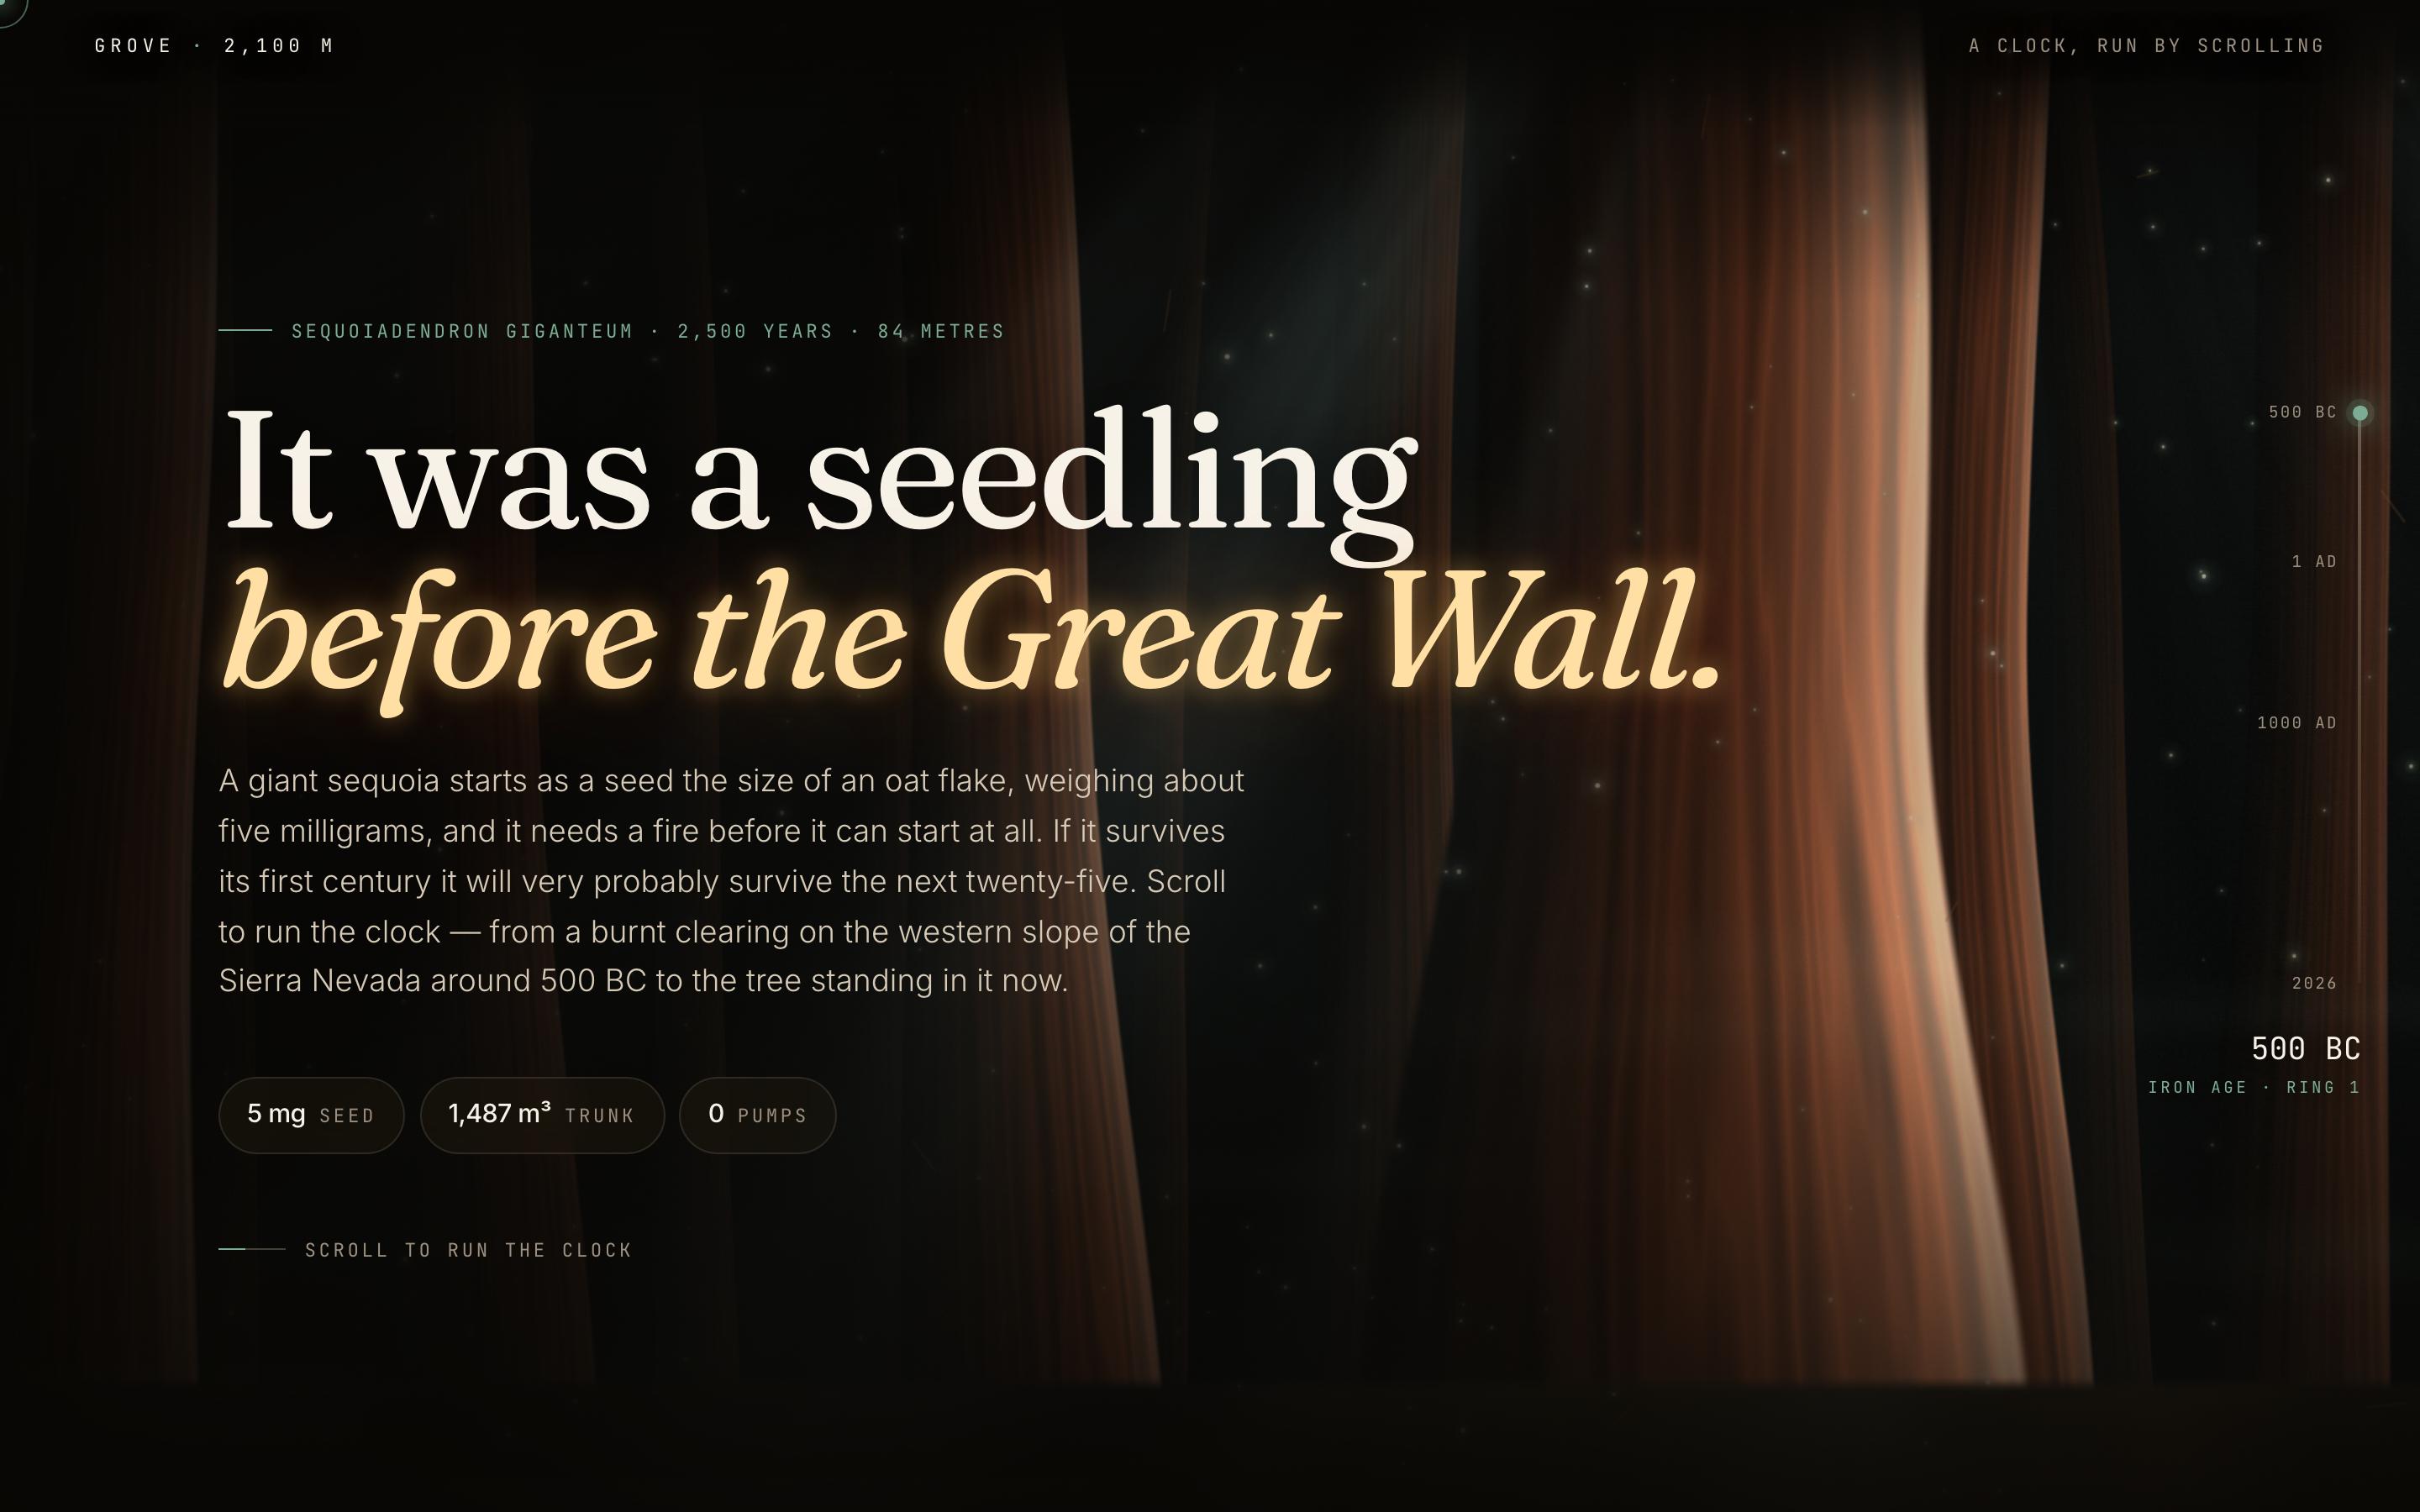
Nature Conservation Website Template — preview

Nature Conservation Website Template

Education

Giant Sequoia

It was a seedling before the Great Wall

CanvasWebGLScroll-driven

ваша следующая идея
заслуживает воплощения

хватит просто думать о ней. возьмите и напишите её. Криво, наполовину — как угодно. Мы превратим её во что-то настоящее.

Продукт

  • Шаблоны
  • Сообщество
  • Тарифные планы
  • Партнёрская программа
  • UXMagic MCP
  • Claude MCP
  • Информация для ИИ

Ресурсы

  • Справочный центр
  • Библиотека Figma
  • Библиотека React
  • Шаблоны мобильных приложений
  • Документация
  • Туториалы

Возможности

  • Из промпта в UI
  • Из изображения в UI
  • Из скетча в UI
  • Клонировать сайт
  • Импорт из Figma
  • AI Wireframe Generator
  • AI Mockup Generator
  • AI Prototype Generator
  • AI Dashboard Generator
  • Все возможности

Сравнения

  • vs UX Pilot
  • vs Relume
  • vs MagicPath
  • vs Magic Patterns
  • vs Banani
  • vs Galileo AI
  • vs v0
  • vs Lovable
  • vs Base44
  • Все конкуренты

Блог

  • AI в воркфлоу UX-дизайнера: что реально работает
  • Шаблоны промптов для SaaS-дашбордов
  • Реальные промпты, которыми мы генерируем продуктовые флоу
  • Промпт-инжиниринг для UX-дизайнеров
  • Лучшие инструменты для вайрфреймов в 2026: сравниваем 10 бесплатных и Pro-вариантов
  • Все статьи

Компания и поддержка

  • Карьера
  • Связаться с нами
  • Политика конфиденциальности
  • Условия использования
  • Настройки cookie
  • Подписывайтесь на нас в Slack
  • Подписывайтесь на нас в Twitter
  • Подписывайтесь на нас в LinkedIn
  • Подписывайтесь на нас в YouTube
  • Подписывайтесь на нас в Instagram

© 2026 UXMagic AI Technologies Inc.