
TL;DR
Useful dashboard design starts with a decision, not a collection of charts. We recommend defining the audience, task, cadence, and next action before selecting KPIs, visualizations, layouts, or interactions. AI can accelerate exploration and repetitive UI work, but teams remain responsible for data meaning, accessibility, edge cases, governance, and validation.
Dashboard design starts with a decision, not a grid
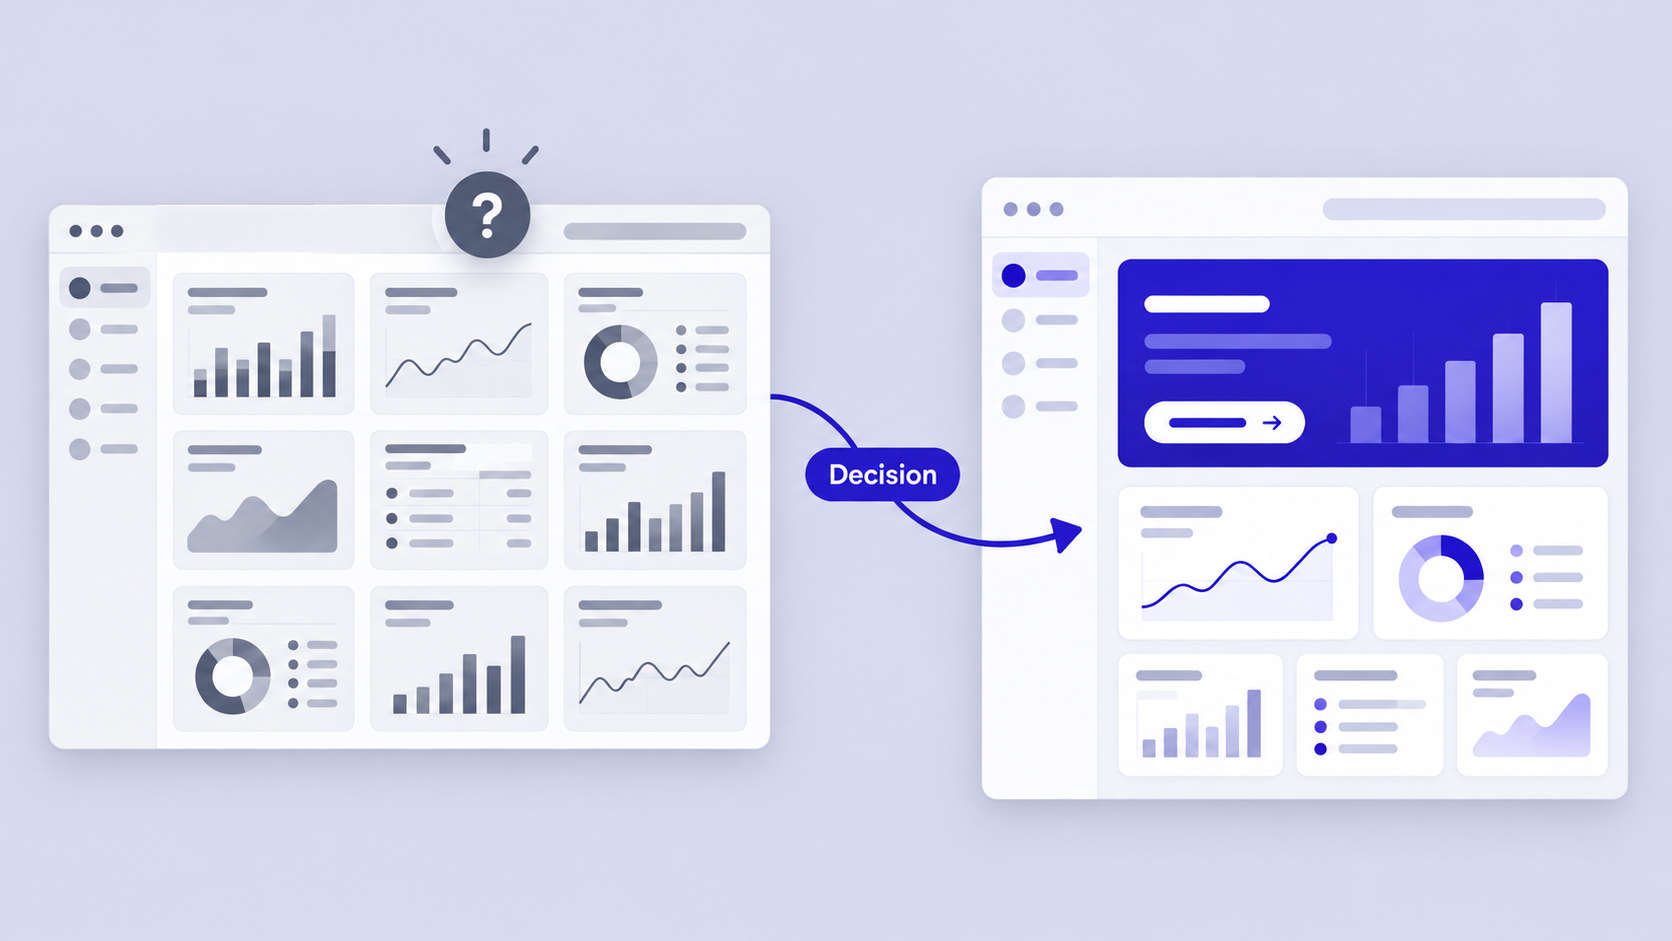
A dashboard can contain the right data and still leave people unsure where to look. That failure often begins before visual design because nobody agreed on the decision the dashboard should support.
Before selecting metrics, we define five things:
- Audience: Who uses the dashboard, and what do they understand?
- Task: What recurring job brings them here?
- Decision: What choice must the data support?
- Cadence: How often is the view checked?
- Consequence: What happens if a signal is missed or misunderstood?
We use a one-sentence dashboard contract: “This view helps [audience] notice [signal] so they can [action].” A sales version might read: “This view helps sales managers identify pipeline shortfalls so they can coach the right representatives before month-end.”
That contract challenges a common assumption: a dashboard should show everything someone might need. It should instead prioritize what deserves attention and provide clear routes to supporting detail.
Visual polish cannot compensate for weak hierarchy. If urgency, ownership, context, and next steps are unclear, an elegant dashboard remains a passive display.
What is dashboard design?
Dashboard design is the organization of data, controls, context, and actions around a repeatable decision. It combines information architecture, data visualization, interaction design, content design, accessibility, and system feedback.
A decision interface explains what changed, why it matters, and what can happen next. A report primarily presents information. A decorative chart collection may look impressive, but it lacks both a coherent question and a usable path forward.
The same foundational principles of design apply. Hierarchy, contrast, alignment, proximity, consistency, and feedback should clarify meaning rather than merely improve appearance.
Build an action-first visual hierarchy
We order content by urgency and decision value, not stakeholder seniority or whichever data arrived first. The most prominent element should represent the most consequential signal, which is not always the largest metric.
A practical hierarchy may contain:
- Primary signal and status
- Comparison or explanatory context
- Recommended action
- Supporting diagnostics
- Detailed records on demand
Size, position, contrast, grouping, labels, and whitespace should reinforce that order. Color should not carry meaning alone. A label such as “Revenue below target” communicates more than a red number, particularly for people with color vision differences.
Choose the right dashboard type before choosing a layout
Dashboard patterns should match the user’s operating rhythm. Strategic, analytical, and operational dashboards have different requirements for density, recency, and interaction.
| Dashboard type | Primary user | Typical cadence | Density | Interaction depth |
|---|---|---|---|---|
| Strategic | Executives and leaders | Periodic | Low | Limited |
| Analytical | Analysts and managers | On demand or periodic | Medium to high | Deep |
| Operational | Frontline and operations teams | Frequent | Medium to high | Action focused |
One product may need all three. A universal dashboard often becomes overloaded because executives need direction, analysts need exploration, and operators need immediate intervention.
Common mappings include:
- Executive analytics: Strategic outcomes with explanatory drill-down
- SaaS administration: Health, exceptions, records, and permission-aware actions
- Finance: Summary KPIs, variance analysis, period comparisons, and precise tables
- Sales: Targets, pipeline movement, team comparisons, and deal detail
- Operations: Alerts, thresholds, owners, recency, and recovery actions
- Healthcare: Role-specific views, protected values, audit trails, access states, and escalation paths
Generated healthcare concepts are starting points, not validated clinical or compliant software. Teams must verify terminology, permissions, privacy, accessibility, policy, and workflow safety with appropriate experts.
Strategic dashboards: progress and direction
A strategic dashboard should emphasize outcomes, targets, trends, and explanations. An executive view might lead with a few decision-critical KPIs, explain material variation, and reveal departmental detail on demand.
Periodic comparisons and concise annotations are often more useful than constant activity. Live motion adds noise when the underlying decision happens less frequently.
Analytical dashboards: exploration and comparison
Analytical dashboards support filtering, cohort comparison, drill-down, and hypothesis testing. People need to see whether an apparent pattern holds across segments, periods, or populations.
We recommend preserving filter context throughout exploration. Definitions, comparison periods, time zones, exclusions, and active constraints should remain explicit so different viewers do not interpret the same chart differently.
Operational dashboards: status and intervention
Operational dashboards surface exceptions, thresholds, recency, ownership, and available actions. They support frequent scanning and prompt intervention.
Every urgent exception should connect to an owner or next step. The interface also needs recovery states for delayed feeds, unavailable systems, partial data, and restricted permissions. Trust deteriorates quickly when freshness is ambiguous.
Select KPIs that tell users what deserves attention
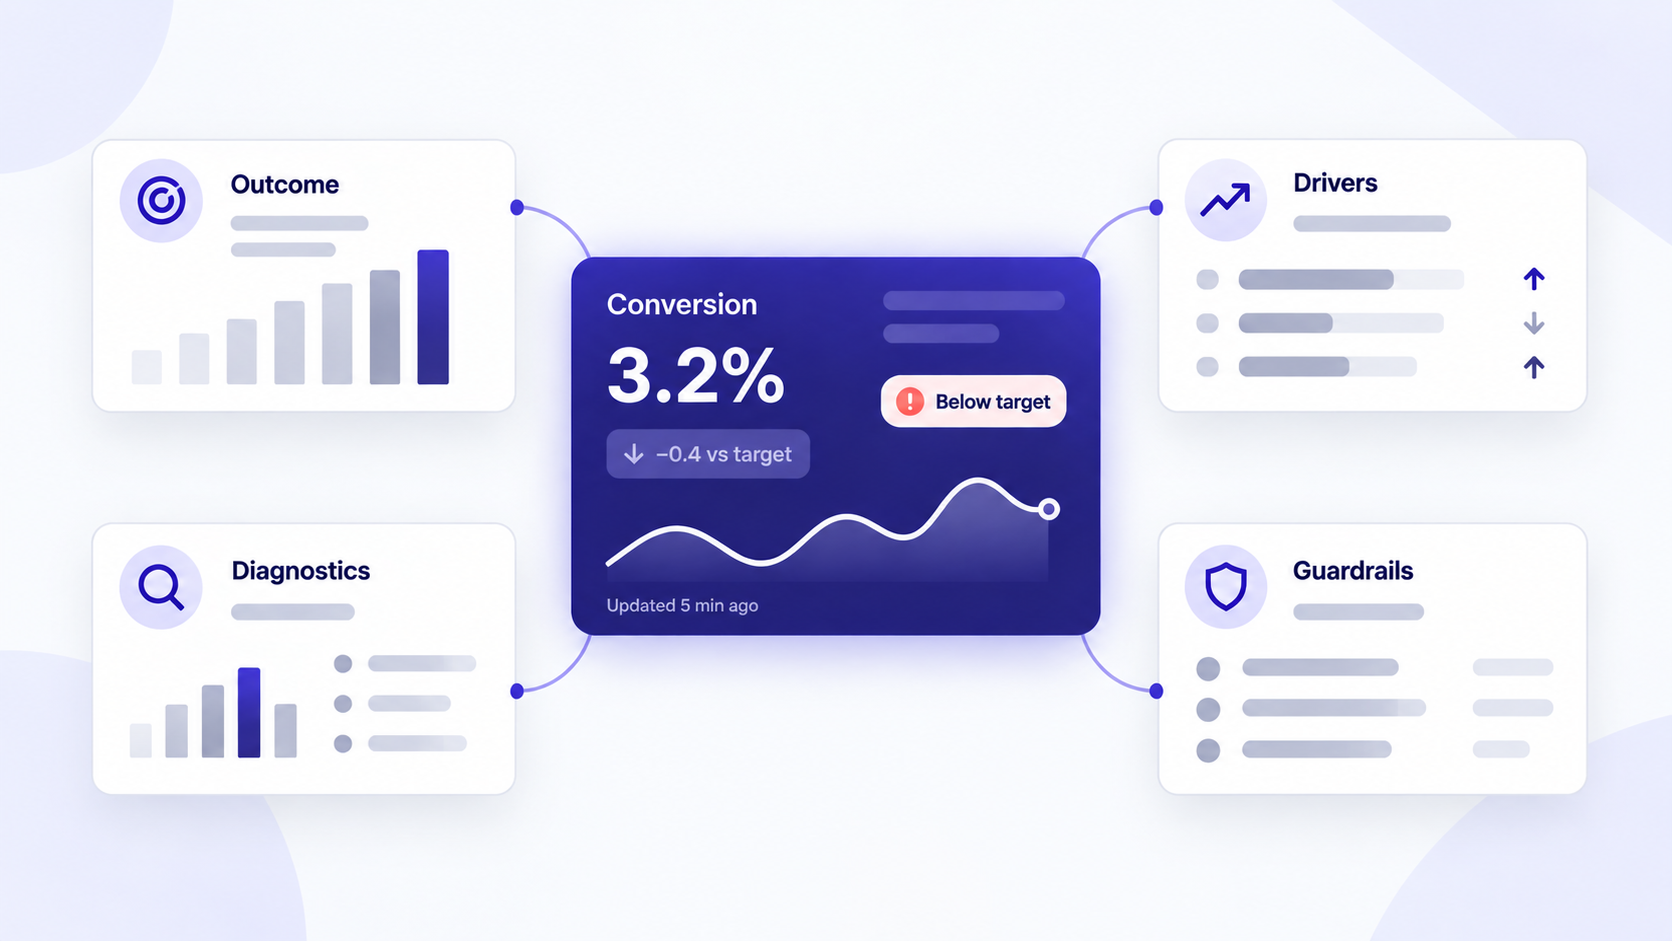
Effective KPI design separates four metric roles:
- Outcomes: The result the team wants
- Drivers: Factors that may influence that result
- Diagnostics: Measures used to investigate change
- Guardrails: Measures intended to prevent harmful optimization
We tie each KPI to a decision, comparison, threshold, owner, and time window. If nobody can explain what they would do when a metric changes, it may belong in an analysis view rather than the primary dashboard.
A standalone number works when its meaning is obvious. Add a target, delta, benchmark, trend, or status when people must judge performance, direction, or urgency.
During stakeholder alignment, we classify requested metrics as primary, supporting, diagnostic, or on demand. This changes the conversation from “Which metric can we remove?” to “Which decision does this metric support?”
Design a KPI card that answers more than “what?”
A KPI card may include a label, value, unit, comparison basis, period, status, and freshness indicator. We include only the elements required to interpret the number.
“Conversion declined from the previous period and was recently updated” provides more context than a percentage alone. The final interface should show the actual comparison basis and refresh time.
Avoid ambiguous red and green signals. State whether movement is favorable, unfavorable, or simply different. A lower value may be positive for churn but negative for retention.
Reduce the wall of cards
Card grids often flatten hierarchy by presenting every metric with equal weight. Cards are containers, not an information architecture.
Group related measures around decisions. A sales section can combine target progress, pipeline movement, and the largest current risk instead of splitting them into unrelated tiles.
Move secondary content into tabs, expandable sections, contextual drill-downs, or detail views. Progressive disclosure reduces initial density while preserving access to evidence.
Match the visualization to the user’s question
We choose charts according to the question, not the desire for visual variety.
| User question | Recommended format |
|---|---|
| What is the exact value? | Number or table |
| Which item ranks highest? | Sorted bar chart |
| How has it changed over time? | Line chart or sparkline |
| How do parts contribute to a whole? | Stacked bar or simple pie chart |
| How is a variable distributed? | Histogram or box plot |
| Are two measures related? | Scatter plot |
| How close are we to a target? | Progress indicator or bullet-style bar |
| Which items need intervention? | Status list, heatmap, or table |
Pie charts can support quick part-to-whole scanning when categories are limited and clearly differentiated. They are weaker when precise comparison matters or values are similar.
Tables are often the right dashboard UI. We use them when people must scan records, compare exact values, sort, filter, select rows, or take record-level action.
Use charts for patterns and tables for precision
Charts help people recognize patterns; tables provide precise values and operational detail. When a workflow requires both, pair an overview chart with an accessible detail table.
Keep scales, units, baselines, sorting, and comparison periods consistent and visible. Truncated axes, mixed units, and silently changing date ranges can create misleading interpretations even when the data is correct.
Add interaction only when it changes the answer
Hover should reveal supplementary detail, never information required to understand a chart. Hover-only content is unavailable on many touch interfaces and can create accessibility barriers.
Use drill-down, zoom, brushing, and cross-filtering when they support a defined analytical path. If an interaction does not help someone refine a question, compare evidence, or act, it is probably decorative complexity.
Build a dashboard layout that survives real content
A reliable layout reflects workflow rather than fashion. Common patterns include:
- Overview-detail: Summary first, exploration below
- Task-led: Queues and actions organized by urgency
- Monitoring: Stable signals designed for repeated scanning
- Split-view: A list or selection beside its detail
- Table-first: Records, filters, comparisons, and bulk actions
- Modular card grid: Independent modules within a flexible grid
A card grid does not determine priority, relationships, navigation, or action. Those decisions still require an explicit information architecture.
Use a responsive grid with clear priority rules. Simply stacking every desktop card can produce a long mobile page that separates the primary signal from its filters and actions.
We also stress-test long labels, large values, localization, missing data, dense records, and narrow screens. A high-fidelity wireframe helps teams assess realistic density and interaction before engineering begins.
Choose a layout pattern by workflow
Overview-detail suits progressive exploration. Task-led layouts suit queues and exceptions. Table-first layouts work well for account or record management.
A SaaS administration dashboard might combine account health, urgent exceptions, a searchable customer table, and permission-aware row actions. That workflow is better served by a task-led or table-first layout than a gallery of equal cards.
Fixed monitoring grids work best for stable, glanceable signals in known environments. Even then, each alert needs a threshold, owner, timestamp, and escalation path.
Define responsive behavior component by component
For each breakpoint, specify whether a component will:
- Reflow into a new arrangement
- Collapse into a summary
- Scroll while preserving headers
- Pin essential filters or actions
- Replace a chart with a compact value
- Move complex detail to a dedicated view
Preserve metric meaning, comparisons, active filters, and critical actions. For tables, horizontal scrolling may be preferable to hiding columns needed for comparison, provided key identifiers stay visible.
Evaluate templates instead of copying them
We judge a dashboard template by its use case, hierarchy, state coverage, accessibility, adaptability, and fit with the product’s design system. Surface similarity to the intended domain is not enough.
Excel, BI, and Home Assistant templates are context-specific starting points. Their data models, audiences, constraints, and display environments may not match a product dashboard.
Strong Figma design system examples offer another test: templates should map to reusable components, tokens, variants, and states rather than isolated styling.
Design filters, drill-downs, tables, and system states as one interaction model
Filters, drill-downs, and tables should behave as one connected system. Global and local filters need unmistakable scope, while active constraints should appear near affected results.
Drill paths must also be predictable. Preserve the query, date range, comparison, scroll position, and return path so people do not have to reconstruct their analysis.
Design beyond the ideal state:
- Loading and first use
- Empty or no results
- Partial or stale data
- Error or offline
- Restricted permissions
- Unavailable records
Tables may also need sorting, filtering, pagination, virtualization, bulk selection, row actions, density controls, and responsive access. These are workflow decisions, not finishing details.
Make filter scope and state visible
Separate global filters from chart-level controls through placement and labeling. A top-level date range might affect the whole view, while a segment selector inside a panel affects only that analysis.
Provide useful defaults, clear reset behavior, saved views, and shareable states where collaboration requires them. Persistent feedback about the selected segment, region, and period helps prevent invisible filtering errors.
Turn edge cases into recovery paths
A system state should explain what happened, what remains available, and what can happen next. “Data unavailable” is less useful than a message that identifies the delayed source, shows unaffected information, and offers a retry or support route.
Use realistic datasets early. Long names, sparse results, loading delays, restricted actions, and high volumes expose structural problems that perfect sample data conceals.
Make dense dashboard UI accessible and trustworthy
Accessible dashboard design requires WCAG-informed contrast, visible focus states, keyboard operation, semantic structure, and status cues that do not depend on color.
Provide text alternatives or accessible data views for charts. Meaningful changes, such as a completed or failed refresh, should be announced appropriately without overwhelming assistive technology users.
Dark mode is not automatically easier to read. Faint gridlines, subtle text, saturated alerts, and low-contrast controls can increase fatigue in dense workflows.
Trust also depends on context. We display definitions, sources, freshness, units, time zones, and calculation logic wherever ambiguity could alter a decision.
Design color as reinforcement, not meaning
Combine color with labels, icons, patterns, shape, or position. An alert should remain understandable when color is unavailable or difficult to distinguish.
Test contrast across default, hover, selected, disabled, focus, and alert states. Repeat those tests in dark mode because direct token inversion rarely preserves hierarchy.
Validate comprehension, not visual preference
Instead of asking only whether people like a dashboard, we ask:
- What needs attention?
- Why does it matter?
- What should happen next?
- Which period and comparison are shown?
- How confident are they in the data?
Test keyboard navigation, zoom, screen-reader structure, color vision differences, and dense workflows. Comprehension and task completion are stronger signals than visual preference.
Use AI to explore dashboard concepts, then apply design judgment
ChatGPT and similar tools can help define requirements, identify potential KPIs, draft labels, structure data, propose layouts, and generate code. They do not validate data meaning, accessibility, security, or the underlying business decision.
Our preferred workflow is:
- Describe the audience, decision, cadence, and primary action.
- Generate a structured first pass.
- Compare contrasting hierarchy and layout options.
- Stress-test realistic data and system states.
- Refine the strongest direction within the design system.
Useful prompt inputs include the audience, use case, primary action, KPIs, devices, data volume, permissions, required states, and accessibility constraints. This follows the broader principle that AI UI should produce editable, shippable foundations, not disposable images.
Describe, design & compare
Generate alternatives for KPI hierarchy, card density, navigation, chart selection, and responsive behavior before polishing one direction. Comparing distinct concepts reveals structural trade-offs earlier.
With uxmagic.ai, teams can turn prompts, screenshots, or requirements into critique-ready dashboard concepts, then use an AI-to-Figma workflow to continue refining them in an editable environment.
The practical value is straightforward: describe, design & compare before expensive implementation decisions harden.
What AI should and should not replace
AI can reduce blank-canvas work, repetitive component assembly, and slow variant production. It can help us compare task-led, split-view, and overview-detail approaches.
It should not replace user research, KPI definition, data semantics, accessibility review, governance, edge-case design, or final interaction judgment. Teams evaluating automation should review AI-powered UI platform selection criteria rather than treating generation speed as the only requirement.
How to evaluate dashboard tools without a generic top-five list
No universal ranking works because dashboard tools solve different problems. We evaluate categories such as AI concept generation, interface design, BI and analytics, code-based visualization, and domain-specific platforms.
Compare output type, data connectivity, collaboration, design-system support, accessibility, governance, and handoff. An AI UI generator supports rapid interface exploration; it does not replace production analytics infrastructure or domain validation.
Dashboard design checklist: from blank canvas to production-ready UI
Our practical workflow is: define, prioritize, structure, visualize, interact, stress-test, validate, and ship.
Before handoff, confirm that:
- Purpose, audience, cadence, and next action are explicit
- KPI definitions, thresholds, owners, and periods are documented
- Hierarchy reflects urgency and decision value
- Each chart answers a specific question
- Responsive behavior is defined per component
- Loading, empty, stale, error, and permission states exist
- Keyboard access, focus, contrast, and chart alternatives are covered
- Performance assumptions reflect realistic data volume
- Permission boundaries and sensitive fields are clear
- Data freshness, sources, units, and time zones are visible where needed
Review examples by their decision model and resilience, not surface style. Inspiration is useful only when it survives realistic content, constrained screens, and imperfect systems.
The rapid concept review
Give the concept to a first-time viewer and ask them to identify the audience, primary signal, comparison period, and next action without explanation.
Then replace ideal data with missing values, long labels, dense records, restricted permissions, and a narrow viewport. If the hierarchy or workflow breaks, the concept is not ready for polish.
Final handoff checks
Document component states, filter scope, drill paths, chart behavior, data definitions, responsive rules, accessibility requirements, and failure recovery.
Engineering, design, and analytics teams should share definitions for metrics, thresholds, recency, permissions, and errors. A polished file is not a complete handoff if those rules remain implicit.
Turn your dashboard brief into an editable concept
Describe your audience, primary decision, KPIs, devices, permissions, and required states in uxmagic.ai. Generate contrasting directions, test them with realistic data, and carry the strongest concept into your design system.