
TL;DR
A dashboard design system should standardize decisions, not screenshots. We recommend defining enforceable rules for dashboard types, visualizations, filter scope, data freshness, responsive priorities, and analytical interactions. Shared components can then implement those rules consistently. The result is dashboard interface design that remains predictable as products, datasets, roles, and devices change.
What a dashboard design system must standardize
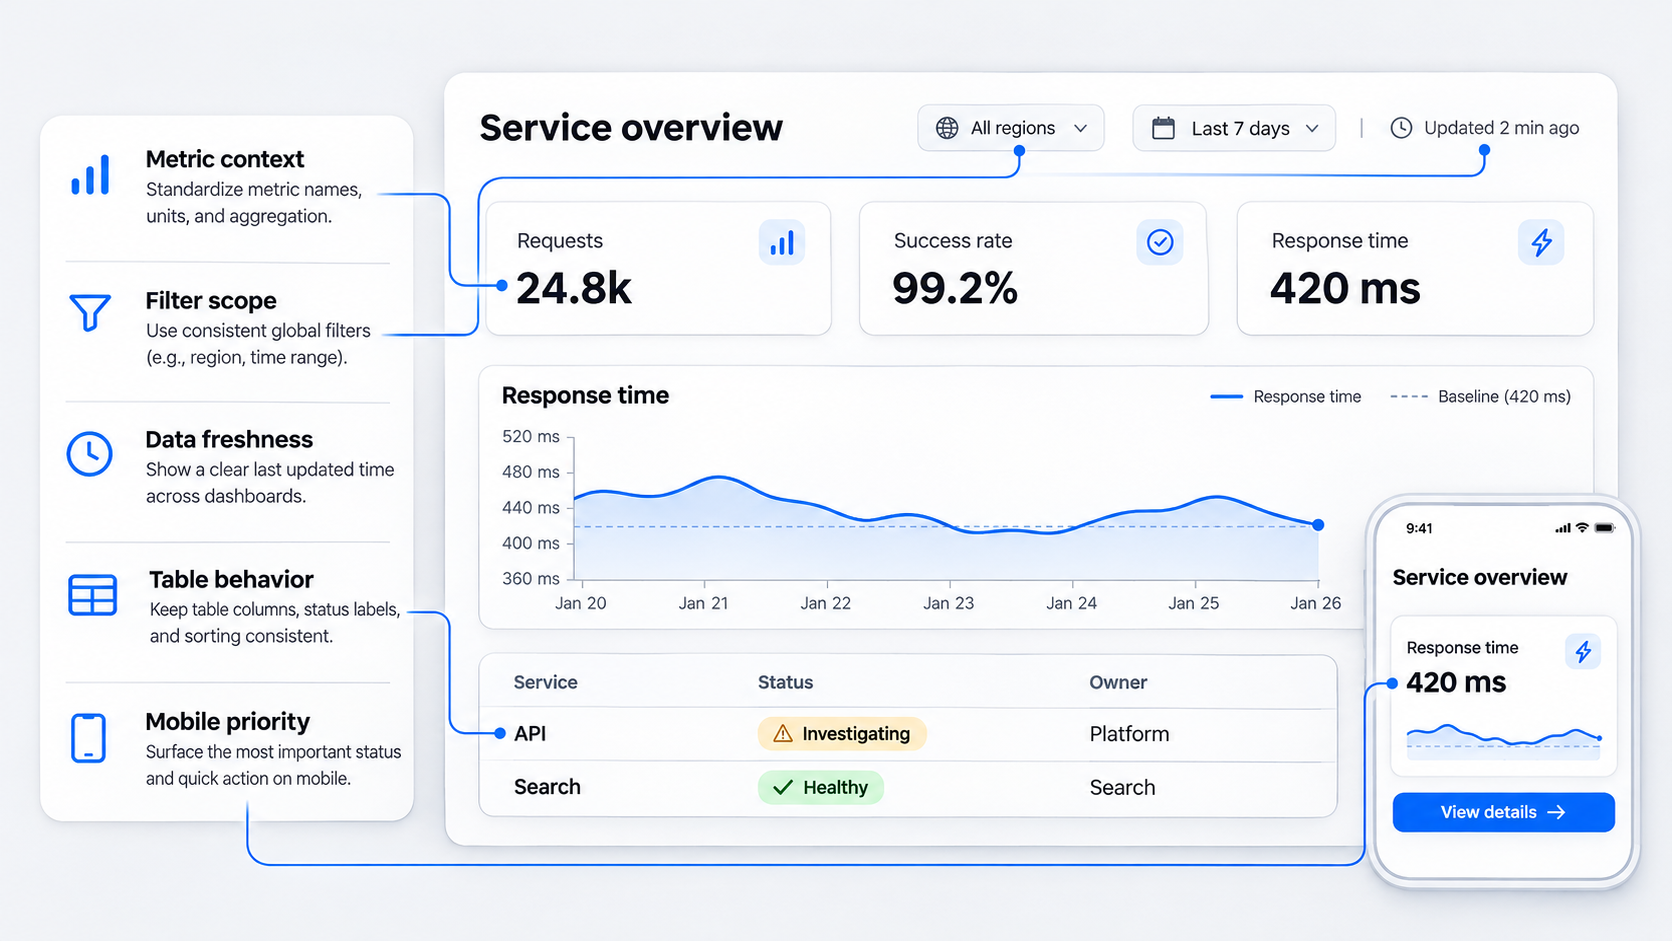 A dashboard design system is more than a collection of polished cards. It is a shared set of decision rules, interaction contracts, and data-display standards for interfaces that help people monitor, compare, investigate, and act on data.
That distinction matters. A dashboard can look consistent in a static mockup while behaving inconsistently in production. One filter persists across pages, another resets without warning, and a third appears global but affects only one chart. Each new metric then introduces another card variation.
Visual foundations still matter. Typography, spacing, color, iconography, and layout establish a coherent interface. They cannot, however, prevent misleading comparisons, conflicting filter logic, inaccessible charts, or unstable updates.
A dashboard-specific system must answer questions such as:
- When is a KPI more useful than a chart?
- Which datasets require a table instead of an overview visualization?
- How are active filters scoped, displayed, persisted, and reset?
- What happens while data loads, refreshes, fails, or becomes stale?
- How do permissions affect totals, comparisons, and empty states?
- What information remains on a mobile overview?
- When should analysis move to a dedicated detail view?
- Which patterns may teams customize, and which must remain fixed?
Many component libraries stop too early. They define how a filter looks but not what it controls. They provide a chart container but not the conditions under which a chart is appropriate. They include loading skeletons but not rules for partial datasets, stale metrics, or unavailable comparison periods.
Our focus is therefore dashboard-specific components, behaviors, and decision rules. Generic tokens and application foundations belong underneath this layer. The dashboard system governs how real data is communicated and manipulated.
Strong systems also connect design decisions to implementation. Our review of what strong Figma design system examples get right shows why reusable libraries need documented usage, states, constraints, and ownership—not just visual anatomy.
The four types of dashboards
Dashboards are often treated as one interface category. That leads to generic patterns because different dashboard types have different jobs.
A useful taxonomy covers operational, analytical, strategic, and tactical dashboards.
| Dashboard type | Primary purpose | Typical time horizon | Density | Refresh expectation | Interaction depth |
|---|---|---|---|---|---|
| Operational | Monitor current conditions and respond | Immediate to short term | High but prioritized | Frequent or event-driven | Fast actions and exception handling |
| Analytical | Explore patterns, causes, and relationships | Variable, often historical | High | Stable during investigation | Deep filtering, comparison, and drill-down |
| Strategic | Track goals and organizational outcomes | Long term | Low to moderate | Periodic | Limited exploration with supporting detail |
| Tactical | Manage team or functional performance | Short to medium term | Moderate | Scheduled or on demand | Comparison, segmentation, and follow-up |
An operational dashboard supports immediate awareness and response. A service operations view might show incidents, affected systems, severity, duration, ownership, and acknowledgment actions. Freshness, alert prioritization, and interaction stability matter more than elaborate historical analysis.
An analytical dashboard supports investigation. People may compare segments, adjust date ranges, inspect distributions, sort large tables, and follow a metric into supporting records. These workflows need precision, persistence, and enough density to preserve relationships between variables.
A strategic dashboard tracks progress toward high-level goals. It usually favors a concise set of KPIs, targets, historical comparisons, and explanatory trends. Constant refreshes would add noise because the relevant decisions occur over longer periods.
A tactical dashboard connects strategic goals to recurring team decisions. A marketing lead might compare campaigns by pipeline contribution, while a support manager monitors backlog, resolution time, and staffing trends. These dashboards need more detail than executive overviews but less exploratory depth than specialist analytical tools.
These categories are not rigid product labels. One product may contain all four, but each surface should declare its dominant purpose. Otherwise, teams combine executive summaries, live monitoring, and deep analysis in one overloaded view.
One visual language, different behavioral profiles
We recommend one visual language with distinct behavioral profiles. Operational and analytical dashboards can share typography, status colors, spacing, control anatomy, and accessibility standards without using identical density, refresh, or interaction rules.
An operational table may prioritize current status, ownership, duration, and row actions. It might update frequently but pause while someone selects records. An analytical table may prioritize configurable columns, stable sorting, advanced filtering, exports, and persistent comparisons.
The same distinction applies to charts. An operational chart may emphasize thresholds and emerging exceptions over a short window. An analytical chart may support segmentation, annotations, comparison periods, and access to exact values.
A single dashboard component library is the wrong goal if it forces every dashboard to use the same widgets in the same way. Shared foundations should reduce unnecessary variation, while behavioral profiles preserve differences rooted in the work.
We organize the system in three layers:
- Shared foundations: visual tokens, accessibility rules, naming conventions, status semantics, and layout primitives.
- Dashboard primitives: filters, KPI treatments, chart frames, data tables, freshness indicators, comparison controls, and drill-down conventions.
- Behavioral profiles: operational, analytical, strategic, and tactical rules for density, refresh, interaction depth, and responsive priority.
This structure creates consistency without pretending that an executive overview and an incident-management surface need the same interaction model.
Choose the right dashboard pattern for the decision
Good dashboard UX design starts with the decision, not a preferred visualization. “We have monthly revenue data” is not a design requirement. “A sales leader needs to identify which regions are falling behind target and decide where to intervene” is.
UI-Patterns describes dashboards as a way to digest information from multiple sources and discover actionable trends. A design system should build on that purpose by helping teams choose among competing patterns.
We use five criteria:
- Comparison need: Is the task about one value, change over time, entities, segments, distributions, or relationships?
- Data volume: Are there a few summaries, many categories, or a large record set?
- Precision: Does the task require directional understanding or exact values?
- Time horizon: Is the focus current state, recent change, or long-term performance?
- Required action: Must someone monitor, acknowledge, investigate, compare, edit, export, or escalate?
Teams can turn those criteria into a decision matrix:
| User need | Preferred pattern | Use when | Avoid when |
|---|---|---|---|
| Judge one important value | KPI | A value requires rapid assessment against context | People must compare many entities |
| Understand change or shape | Chart | Trend, distribution, composition, or relationship matters | Exact lookup is the primary task |
| Inspect exact records | Table | Precision, ranking, sorting, or row actions matter | Only one aggregate judgment is needed |
| Compare a small set directly | Comparison view | Differences must align across entities or periods | The comparison contains too many dimensions |
| Investigate causes | Drill-down | An overview signal leads to explanatory detail | Navigation would discard filter or time context |
| Respond to exceptions | Exception queue | A subset requires attention | Every record deserves equal attention |
A dedicated detail page is often clearer than another dropdown, tab, expandable card, or chart mode. We recommend moving analysis into a focused view when it requires a different information hierarchy, additional filters, record-level evidence, or a longer interaction sequence.
The overview should answer, “Where should attention go?” The detail view should explain what is happening, why it matters, and what action is available.
Use a KPI when one value needs immediate judgment
A KPI is appropriate when one value deserves immediate assessment. The number alone is rarely enough.
A governed KPI pattern should define:
- Metric name and unit
- Current value
- Target, threshold, or expected range
- Comparison value and period
- Direction of change
- Whether higher or lower is desirable
- Last-updated time
- Availability or confidence caveats
- Drill-down destination, when applicable
A revenue total communicates magnitude but not performance. Is it above target? Is it monthly or quarterly? Is it final or projected? Is the increase measured against the previous period, the equivalent prior-year period, or a selected baseline?
Direction also needs semantic context. An upward arrow may be positive for conversion but negative for incident duration. Color cannot carry that meaning alone. Labels such as “above target” or “higher than the previous period” are clearer.
KPI cards become weak when people need to compare many entities. Separate containers force the eye to jump among labels and baselines. An aligned metric row, compact comparison table, or coordinated chart usually supports scanning more effectively.
An executive dashboard might use a compact row for revenue, margin, retention, and forecast accuracy. Each metric would include its target and comparison period. Selecting one could open a dedicated analytical view instead of expanding every possible detail inside the overview.
Use a chart for patterns, distributions, and change
Charts are appropriate when shape and relationship matter more than isolated values. The system should match chart selection to the analytical task instead of allowing arbitrary substitutions.
Useful task-to-chart rules include:
- Trend: line or area chart with a meaningful time axis
- Category comparison: aligned bars
- Composition: stacked bars when both total and parts matter
- Distribution: histogram, box plot, or another distribution-aware view
- Relationship: scatter plot when correlation or clustering matters
- Progress toward a threshold: compact bar or bullet-style treatment
- Event sequence: timeline with annotated changes
Every approved chart should define units, scales, baselines, thresholds, comparison periods, missing-data treatment, annotations, and tooltip behavior. Without those contracts, a chart can be visually consistent yet analytically misleading.
We also require accessible summaries. Important findings must not disappear when someone cannot distinguish colors, use a pointer, or interpret a dense visual. A concise text summary or tabular alternative should expose key values and changes.
Use a table when precision and investigation matter
Tables are not a fallback for failed visualization. They are the right pattern for lookup, ranking, multivariable comparison, record-level investigation, and row-specific action.
An analytical table may need:
- Single- or multi-column sorting
- Column and dataset filters
- Pinned identifiers
- Persistent column order and visibility
- Row selection and bulk actions
- Keyboard navigation
- Virtualized loading for large datasets
- Controlled horizontal overflow
- Exact values and units
- Exports that respect active criteria
Suppose a revenue dashboard supports account investigation. Its table could pin the account name and total revenue, preserve sort state, and move secondary fields into controlled horizontal overflow. That is more useful than turning every account into a card or removing fields until the table no longer supports the task.
Simplification should remove noise, not analytical capability. If a decision depends on region, owner, contract status, renewal date, current revenue, prior-period revenue, and variance, hiding most fields is not clarity. It is task failure.
Use a comparison view or drill-down for deeper analysis
Comparison views align a small set of entities, segments, scenarios, or periods around the same measures. They work when people must understand differences without mentally combining separate screens.
A drill-down creates a stable route from a signal to its causes and evidence. The destination should inherit relevant context, including:
- Selected date range
- Segment and region filters
- Comparison period
- Metric definition
- Time zone
- Applied permission scope
- Originating dashboard state
People should not have to rebuild an investigation after navigating. If someone selects declining retention for a particular segment and region, the analytical view should open with that context intact.
This behavior needs testing, not just illustration. Interactive prototypes can validate behavior, states, and transitions before teams commit to filter persistence, drill-down navigation, or complex table interactions.
Apply the five-second rule without stripping away expertise
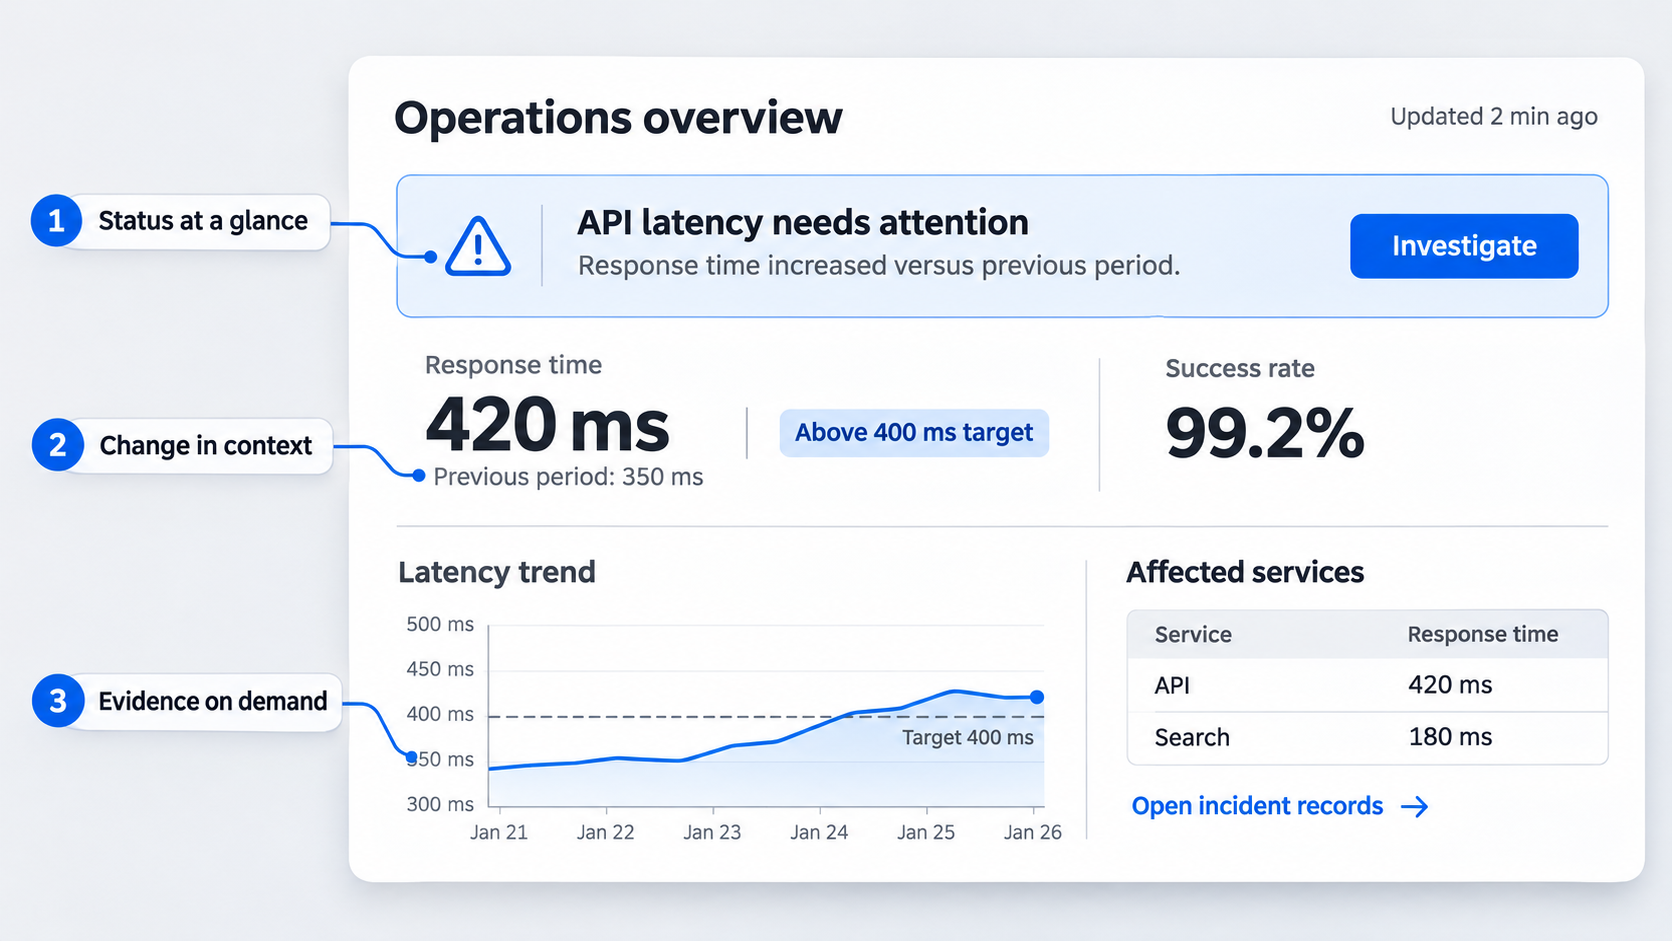 The “five-second rule” is best treated as a hierarchy test, not a measured guarantee. A quick scan should reveal status, meaningful change, and required attention. It does not need to explain the entire dataset.
Used badly, this convention becomes an excuse to remove context, hide uncertainty, and replace analytical tools with oversized numbers. Expert users still need evidence, relationships, and paths to investigate.
We prioritize:
- Exceptions that require attention
- Current status against a meaningful baseline
- Material changes
- Available actions
- Supporting evidence and investigation paths
UXPin’s dashboard design guidance emphasizes that dashboards should convey a coherent story and support informed decisions without overwhelming people. We agree, but the system must define how that story survives real data states—not only how it appears in an ideal example.
What users should understand in five seconds
After an initial scan, someone should be able to answer:
- What changed?
- Is the change good, bad, or uncertain?
- Where is attention needed?
- What action is available?
Explicit language beats implied meaning. “Response time increased versus the previous period” is stronger than a red arrow beside an unexplained value, especially when the threshold is unclear.
Comparison context should appear beside the value it qualifies. People should not need a legend at the bottom of the screen to interpret the primary status.
Color should reinforce meaning, not define it. Labels, symbols, patterns, position, and text preserve understanding for people with different visual abilities and in monochrome exports.
The next layer can contain diagnosis. Someone might select an affected region, inspect the trend, compare services, and open incident records. Fast recognition and deep analysis are complementary when the hierarchy is deliberate.
Why card-heavy layouts often fail
Cards are useful when content has a distinct boundary, action, or independent lifecycle. They are overused when every number, filter, chart, and message receives its own container.
Card-heavy dashboard interface design creates predictable problems:
- Borders and padding consume space.
- Related values lose alignment.
- Repeated headers add visual noise.
- Different card sizes impede comparison.
- Responsive stacking creates long mobile pages.
- Teams create endless variants for slightly different content.
When comparison is the primary task, aligned metric rows are often better. When exact cross-entity analysis matters, use a table. When charts share a time axis, a coordinated view may preserve relationships more effectively than isolated cards.
Our practical test is simple: does the boundary communicate meaningful independence? If removing the card improves alignment without confusing ownership or interaction, the card probably was not helping.
Define filter scope before designing filter controls
Dashboard filter design begins with scope. Placement, persistence, and effect matter more than whether a filter appears as a dropdown, chip, date picker, segmented control, or command menu.
A dashboard design system should distinguish four scopes:
- Global filters: affect multiple pages or the dashboard workspace.
- Page-level filters: affect compatible data on one page.
- Section-level filters: affect a defined group of related views.
- Component-level filters: affect one table, chart, or module.
Each pattern needs documented behavior for defaults, dependencies, reset actions, persistence, URL state, session state, shared links, and unavailable values. Applied criteria must remain visible near the affected data.
A reference implementation might use a global region filter that persists across pages, a section date range for one analysis module, and a local account-status filter for a table. Each scope needs a visible label and predictable reset action.
Global and page-level filters
A global filter should be global only when its dimension is valid across every affected dataset. A region selection cannot honestly filter the entire dashboard if some metrics lack regional data.
When compatibility is incomplete, choose one documented behavior:
- Disable incompatible views and explain why.
- Leave them unchanged and label them as unaffected.
- Transform the filter into a valid equivalent.
- Prevent a selection that would create an invalid state.
Silent inconsistency is not acceptable.
Persistence also needs an explicit contract. Does the filter survive page navigation? Is it encoded in the URL? Does a shared link reproduce the same view? If recipients have different permissions, what will they see?
Page-level filters should sit within the page context and identify the affected content. A reset should return to a defined default, not an ambiguous prior state.
Section and component filters
Local controls must remain visually attached to their scope. A filter in the page header that affects only one chart invites misinterpretation.
Teams can establish section boundaries through headings, layout, background treatment, or explicit scope labels. We prefer labels such as “Filters for revenue analysis” when proximity alone may not be reliable.
Component-level controls work for changing table columns, selecting a chart measure, or filtering one record set. They should not resemble global controls unless their scope is equally broad.
If a local selection changes a value that also appears elsewhere, disclose the difference. Two revenue totals with different hidden filter contexts will quickly damage trust.
Dependent filters and date ranges
Dependent filters require rules for valid combinations. If selecting a country changes the available regions, preserve compatible choices, explain removed values, and avoid resetting unrelated criteria.
Date ranges need precise definitions for:
- Time zone
- Inclusive or exclusive boundaries
- Calendar versus rolling periods
- Current-period completeness
- Comparison-period calculation
- Fiscal calendar behavior
- Available range
- Source-specific availability
- Daylight-saving changes
An incomplete current period should not be compared with a complete previous period without qualification. A prior-year comparison should identify when the equivalent range is unavailable.
When options change, preserve context where possible. If a subregion becomes invalid after the country changes, keep the new country, clear only the incompatible subregion, and explain the change.
Create data-trust contracts for every dashboard view
Dashboard data visualization design is not trustworthy merely because the numbers were accurate at one point. People also need to understand freshness, completeness, permission scope, and refresh behavior.
Every dashboard view should distinguish among:
- A genuine zero
- Missing data
- An unavailable source
- No results under current filters
- Partial results
- Restricted data
- A failed request
- A value still being calculated
These states are not interchangeable. Displaying zero for a failed source creates a false conclusion. Showing a generic error for restricted data directs people toward the wrong remedy.
Fresh, stale, and refreshing data
Each data surface should expose a last-updated time when freshness affects interpretation. The system should also define when data becomes stale and how that condition appears.
Refresh behavior may be:
- Automatic on a known schedule
- Event-driven
- Manual
- Temporarily paused
- Paused by the user
- Failed
- Delayed by an unavailable source
Live data is not automatically better UX. Uncontrolled updates can move rows, replace values during comparison, clear selections, or make people doubt what they just saw.
On an operations dashboard, automatic refresh might pause while someone selects table rows. The interface can explain that updates are paused, retain the last-updated timestamp, and mark affected metrics as stale when appropriate.
Once the task is complete, the system can announce that new data is available and offer a controlled refresh. This protects focus without concealing freshness.
Partial and incomparable data
Partial data needs a visible boundary. If one regional source is delayed, an overall total should not appear complete unless the aggregation method safely accounts for the delay.
Useful partial-data messages identify:
- The delayed source or segment
- Affected metrics
- The latest complete period
- Whether totals exclude missing records
- The expected update, if known
- Available actions
Comparison periods also require compatibility. A new product may lack a prior-year baseline. A permission change may expose the current total while hiding part of the previous period.
Label unavailable or incomplete comparisons instead of converting them to zero or dropping the context. “Comparison unavailable: prior-period data is incomplete” is more trustworthy than an empty indicator.
Restricted and unavailable data
Permission restrictions should remain distinct from failures and genuine absence. The explanation must be accurate without exposing sensitive information about hidden records.
A restricted state might explain that access rules exclude some values and link to an approved permission workflow. It should not reveal protected names, counts, or categories.
System errors need retry behavior and diagnostic context. Empty results should suggest reviewing active filters. Genuine absence can explain that no records exist for the selected period.
These differences belong in component contracts, acceptance criteria, and test coverage. One generic empty-state illustration cannot represent every data condition safely.
Standardize charts and tables for serious analytical work
Chart and table components need behavioral standards that remain consistent across products and datasets. Otherwise, identical interactions produce different outcomes, forcing people to relearn basic operations on every page.
Accessibility and precision are requirements, not final-stage polish. Define keyboard behavior, focus order, screen-reader names, color-independent encoding, value formatting, and alternatives to visual information.
The system should also reject forced cardization. Some datasets belong in coordinated charts, aligned comparison grids, or dense tables—not isolated rectangular widgets.
Chart standards
An approved chart pattern should document:
- Supported analytical tasks
- Required and optional axes
- Scale and baseline rules
- Unit and number formatting
- Legend placement and interaction
- Threshold representation
- Missing and estimated data
- Annotations
- Comparison-period behavior
- Tooltip content and persistence
- Selection and zoom behavior
- Keyboard access
- Text or tabular alternatives
- Responsive fallback
- Export treatment
Truncated axes may support some analytical tasks but can exaggerate small differences. Define where a zero baseline is required and where a focused range is acceptable with clear labeling.
Tooltips should add detail, not hold essential meaning hostage. Thresholds, units, and major annotations must remain understandable without precise pointer interaction.
Color-independent encoding can use direct labels, shapes, patterns, line styles, position, or symbols. When a chart communicates a key finding, a nearby summary should state it directly.
Limit animation in frequently updating dashboards. Constantly redrawing lines or reordering bars interrupts comparison and focus. Preserve the prior state long enough for people to understand what changed.
Table standards
A dashboard table specification should define:
- Default and permitted sorts
- Single- or multi-column sorting
- Global and column filters
- Pagination, incremental loading, or virtualization
- Row density options
- Pinned columns
- Column visibility and order
- Horizontal overflow
- Row selection and bulk actions
- Inline and row-level actions
- Editable-cell behavior
- Loading and error states
- Export behavior
- Keyboard navigation
- Saved-view rules
For large datasets, virtualization can support performance without removing access to records. The implementation must still account for keyboard movement, assistive technology, row counts, selection across unloaded records, and exports.
Wide tables should pin identifiers and task-critical totals. Secondary fields can use controlled horizontal overflow, but the interface should indicate that more columns are available.
Responsive behavior should preserve the task. Converting every row into a vertical card may destroy comparison, while removing columns may hide fields required for action. Focused mobile views, column presets, or record details are often stronger alternatives.
Design responsive dashboards by reprioritizing decisions
Responsive dashboard design is not a desktop interface stacked into a narrow column. That approach preserves every widget while destroying hierarchy, comparison, and navigation context.
We rank content against three criteria:
- Decision value: Does the information change what someone does?
- Urgency: How quickly must the decision happen?
- Frequency: How often is the task performed on this device?
The responsive system can then define what stays visible, what becomes summarized, what moves into a focused view, and what is intentionally unavailable on smaller screens.
Active filters, freshness indicators, and navigation context should survive breakpoint changes. Mobile users still need to know which region, period, and status criteria shape the values they see.
Teams can use a mobile wireframe system for usable app flows to test those priorities before refining the interface.
What belongs on the mobile overview
A mobile overview should contain urgent status, essential comparisons, and frequent actions. It should not preserve every desktop analysis at a smaller size.
A mobile incident dashboard might prioritize:
- Current severity
- Affected service
- Incident duration
- Assigned owner
- Acknowledge or escalate action
- Last-updated time
Historical charts, event logs, related changes, and multivariable comparisons can move into focused detail views. The overview retains decision value without treating a phone as an equivalent analytical canvas.
Compact does not mean context-free. A KPI still needs its unit and comparison. A status needs an explicit label. A filter summary needs a visible edit or reset action.
Progressive disclosure and compact controls
Progressive disclosure works when the first layer supports the immediate decision and the next offers predictable detail. It fails when essential criteria disappear behind ambiguous icons or repeated taps.
Useful responsive patterns include:
- Condensed summaries that expand into structured detail
- Dedicated filter panels with visible applied criteria
- Focused chart views with accessible data tables
- Table column presets for specific tasks
- Sticky action areas for urgent workflows
- Detail screens that preserve origin and filter context
Touch targets must remain operable, labels readable, and focus order logical. Dense desktop controls should not simply shrink.
Applied criteria must remain visible when the filter panel closes. A summary such as “Europe · Enterprise · Recent period” is more informative than a filter count when those choices materially affect the metric.
When not to reproduce the desktop dashboard
We do not recommend reproducing desktop analysis when the smaller format would reduce accuracy, conceal relationships, or encourage mistaken decisions.
Task-specific mobile flows are often better for:
- Acknowledging incidents
- Monitoring exceptions
- Reviewing urgent status changes
- Approving or escalating items
- Checking a concise KPI set
- Opening a focused record
Complex cohort analysis, wide financial comparisons, and multivariable exploration may belong on larger screens. Mobile can still provide a summary, alert, or saved result with a clear route to the appropriate environment.
The goal is not feature parity at every breakpoint. It is decision continuity across devices.
Design a dashboard using AI without creating pattern debt
AI can accelerate dashboard exploration, but it cannot replace system rules. Without constraints, generated work may look convincing while hiding inconsistent filters, impossible data states, or repetitive card layouts.
We use a repeatable workflow:
- Describe the user, decision, and data.
- Constrain the output with system rules.
- Generate meaningfully different directions.
- Validate behavior, integrity, and accessibility.
- Govern recurring solutions as reusable patterns.
This separates a generated screen from a viable product direction. Our guide to AI interfaces that are actually shippable explains why generated output still needs constraints, state coverage, and implementation review.
With the UXMagic AI UI generator, teams can describe a dashboard brief and generate interface directions for evaluation. The output is a starting point; the system determines whether its patterns deserve reuse.
Describe the decision before the screen
A useful AI dashboard design prompt should include:
- Dashboard type
- User role
- Primary decision
- Required action
- Available metrics and dimensions
- Data volume
- Update frequency
- Device priorities
- Filter scopes
- Permissions
- Comparison periods
- Drill-down destinations
- Data-trust requirements
“Create a modern analytics dashboard” is too vague. A stronger prompt describes an operational dashboard for service managers deciding which incidents require intervention. It prioritizes severity, affected service, duration, ownership, acknowledgment, refresh behavior, filter scope, freshness, and mobile actions.
That gives AI a decision model rather than a visual genre. It also provides criteria for reviewing the result.
Generate controlled dashboard ideas
Meaningful alternatives should change the information strategy, not merely rearrange cards.
We recommend exploring a constrained set of directions:
- Metric-led: a compact status summary leads into evidence.
- Table-led: investigation and row-level action dominate.
- Exception-led: abnormal items appear before normal performance.
- Comparison-led: aligned entities or periods drive the hierarchy.
A strategic executive view may be metric-led, while a revenue operations workspace may be table-led. Incident management is often exception-led. Market performance may favor comparison.
Generated options should use the same decision and data constraints. Otherwise, the team is comparing unrelated concepts rather than alternative solutions to one problem.
After selecting a direction, an AI-to-Figma workflow can turn generated UI into editable, review-ready designs. Teams can then inspect hierarchy, apply approved components, annotate behavior, and resolve states before implementation.
Validate before promoting a pattern
AI output should pass the same checks as human-created dashboard UX design.
Our validation checklist asks:
- Can people identify status and required attention quickly?
- Does every filter have a visible, accurate scope?
- Are units, targets, and comparison periods explicit?
- Are zero, missing, partial, stale, and restricted data distinct?
- Can people complete the primary action?
- Does the responsive hierarchy preserve decision value?
- Are charts and tables accessible?
- Does drill-down preserve context?
- Does refresh behavior protect focus?
- Does the pattern already exist in the system?
Only recurring, validated solutions should enter the governed library. One attractive screen is evidence of a direction, not proof of a reusable pattern.
Govern the system with a reusable dashboard specification
A dashboard design system stays healthy through governance. Documentation should make each pattern testable, reviewable, versioned, and replaceable.
We recommend assigning ownership across design, product, engineering, data, and accessibility. The exact model can vary, but teams must know who approves filter behavior, changes metric definitions, and manages deprecated patterns.
A dashboard specification is more useful than an inspiration gallery because it captures the decision behind the interface. Teams can use the following structure as a dashboard design system template.
Dashboard pattern template
Copy this specification for each governed pattern:
Pattern name:
Owner:
Version:
Status: proposed / approved / deprecated

User decision:
Primary user roles:
Supported dashboard types:
Required action:

Use when:
Do not use when:
Approved alternatives:

Data requirements:
- Required metrics
- Required dimensions
- Data-volume constraints
- Units and formatting
- Comparison requirements
- Missing and partial data behavior
- Permission considerations

Filter behavior:
- Global scope
- Page scope
- Section scope
- Component scope
- Defaults
- Dependencies
- Persistence
- URL or session behavior
- Reset behavior

Refresh model:
- Automatic, manual, or event-driven
- Refresh trigger
- Stale threshold
- Pause conditions
- Failure treatment
- Last-updated display

Responsive priority:
- Mobile overview content
- Deferred content
- Focused mobile actions
- Table and chart adaptations
- Context preserved across breakpoints

Accessibility:
- Keyboard behavior
- Focus order
- Screen-reader labels
- Color-independent encoding
- Text or tabular alternative
- Motion constraints

Known constraints:
Approved examples:
Explicit anti-patterns:
Analytics events:
Test coverage:
Migration notes:
Approved examples should use realistic data and cover loading, partial, stale, empty, restricted, error, mobile, long-label, and high-volume conditions.
Anti-patterns are equally valuable. A filter specification might forbid unlabeled local controls in the global header. A KPI specification might reject values without units or comparison context.
Contribution and versioning rules
A proposed pattern should solve a recurring problem that existing patterns do not cover. “Another team designed it differently” is not enough.
A contribution should include:
- User problem and affected roles
- Evidence of recurrence
- Existing patterns considered
- Reasons those patterns are insufficient
- Supported dashboard profiles
- Behavioral specification
- Accessibility review
- Data-state coverage
- Prototype or implementation evidence
- Migration impact
- Named owner
Review checkpoints should involve the disciplines affected by the behavior. Filter changes may require design, engineering, data, and analytics review. A live-refresh pattern may also need performance and accessibility input.
Version changes need release notes and migration plans. When behavior changes materially, teams should know which dashboards are affected, how the old version will be supported, and how analytics will distinguish versions.
Constrain customization before expanding it
More dashboard customization does not automatically create more value. Movable widgets, configurable layouts, and unrestricted chart choices can produce unsupported states that are difficult to compare or maintain.
We recommend starting with opinionated role-based defaults. Analysts, operators, managers, and executives may receive different configurations because their recurring decisions differ.
Controlled customization can support evidenced needs such as:
- Saving approved filter combinations
- Choosing compatible column presets
- Reordering a constrained set of modules
- Pinning frequently monitored entities
- Selecting validated comparison periods
Compatibility rules matter. A widget should not accept a dataset missing required dimensions. Layout controls should not permit unusable widths. Defaults must remain recoverable.
Configurations are product surfaces, not personal files. They need owners, versions, migration behavior, support documentation, analytics, and permission rules.
Measure whether customization improves task completion, repeated use, or operational efficiency. A count of movable widgets does not show whether the experience works.
Adoption metrics that reveal system health
Component usage alone does not show whether a dashboard design system is effective. A chart component may be widely used but repeatedly configured with misleading comparisons.
We recommend tracking:
- Pattern reuse across eligible dashboards
- Documented exceptions
- Implementation variance from specifications
- Accessibility defects
- Data-state defects
- Filter-scope inconsistencies
- Time from approved direction to shipped interface
- Migration completion
- Support issues tied to dashboard behavior
- Configuration reuse
- Completion of primary tasks
Exceptions deserve analysis. Some reveal legitimate system gaps; others indicate weak adoption, unclear documentation, or requirements that should be standardized.
Rarely used customization options should be retired when they create broken, incomparable, or unsupported states. Governance is how we protect clarity, trust, accessibility, and maintainability as dashboards scale.
Describe, design, and ship a governed dashboard
Start with the decision your dashboard must support, then generate interface directions against explicit data, filter, refresh, accessibility, and responsive constraints. Use UXMagic to turn a structured brief into editable dashboard concepts, validate the strongest direction, and promote only proven patterns into your design system.