
TL;DR
The defining dashboard UI design trends 2026 are not dark mode, gradients, glass effects, or another grid of rounded cards. Dashboards are becoming decision systems: they summarize meaningful changes, explain the evidence, prioritize exceptions, and help users act without losing control. The strongest patterns include AI-native guidance, decision-centric hierarchy, progressive disclosure, purposeful density, user-governed adaptation, actionable monitoring, narrative charts, and calm real-time behavior.
Dashboard UI design trends 2026: what actually changed
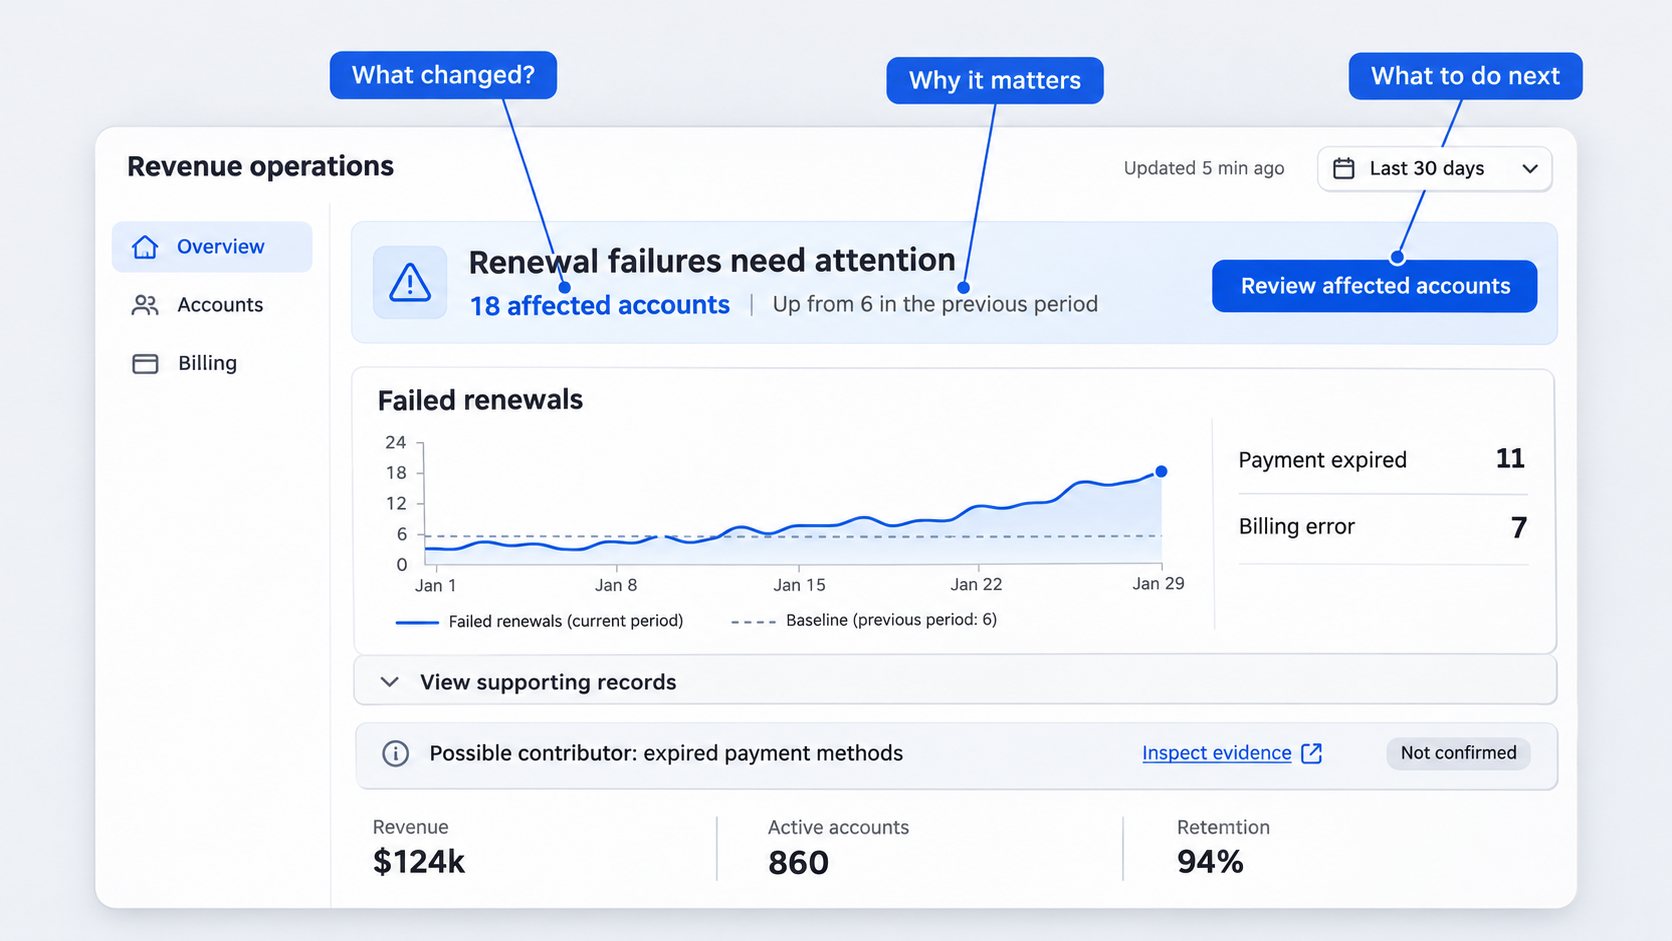 The best dashboards of 2026 do not simply show more data. They decide what deserves attention, explain why it matters, and keep the rest accessible without letting it dominate the screen.
That is the central shift behind dashboard UI and UX design in 2026: moving from passive data display to guided decision-making. A modern dashboard should help someone recognize a change, assess its significance, inspect the supporting evidence, and complete an appropriate action.
Treatments such as dark mode, rounded cards, gradients, and glass effects can make an interface look current. They do not automatically improve comprehension, trust, accessibility, or task completion.
This distinction matters because dashboard inspiration is abundant. One prominent resource presents 35 dashboard templates, while visual platforms contain hundreds of analytics dashboard and admin-panel examples. Teams do not lack polished references. They lack reliable criteria for deciding which patterns deserve to ship.
We evaluate dashboard design with three questions:
- Can users identify what changed?
- Can they understand why it matters?
- Can they confidently decide what to do next?
That lens separates structural improvements from recycled styling. A visual treatment may support the product’s identity, but it is not a product strategy.
| Trend | User value | Implementation effort | Primary risk | Best-fit dashboard |
|---|---|---|---|---|
| AI-native explanations and actions | High | High | Unsupported or opaque output | Analytics, finance, operations |
| Decision-centric layouts | High | Medium | Oversimplifying expert workflows | SaaS, executive, product |
| Progressive disclosure | High | Medium | Hiding frequently needed details | Operations, admin, analytics |
| High-density interface modes | High for experts | Medium | Visual overload without hierarchy | Cybersecurity, finance, enterprise |
| User-governed adaptation | Medium to high | High | Unpredictable layout changes | Role-based enterprise products |
| Exception-led monitoring | High | Medium to high | Alert fatigue | Operations, security, infrastructure |
| Narrative visualization | High | Medium | Implying unsupported causation | Product, finance, executive |
| Calm real-time updates | High | Medium | Stale or misunderstood data | Live operations, logistics, monitoring |
These patterns are not mutually exclusive. A strong operations dashboard might combine exception-led monitoring, dense tables, AI explanations, stable saved views, and controlled live updates.
The goal is not to include every trend. It is to choose the patterns that improve a specific decision and reject those that merely decorate the screen.
The 2026 dashboard test
Before approving a dashboard direction, we recommend checking whether it answers four questions in order.
What changed?
The interface should reveal meaningful movement without making users compare every number manually. It might highlight a threshold breach, conversion decline, delayed process, or unexpected difference between segments.
Why did it change?
The dashboard should connect the change to relevant releases, segments, incidents, source records, assumptions, or model explanations. If the cause is uncertain, the interface should say so rather than manufacture confidence.
What requires attention?
Not every change deserves equal prominence. The interface should distinguish normal variation from conditions that create risk, block progress, or require approval.
What can the user safely do next?
The next step might be inspecting affected records, assigning an owner, approving a response, changing a threshold, or dismissing an understood exception. Consequential actions need clear scope, confirmation, and recovery.
A dashboard that answers only the first question remains primarily a reporting surface. A stronger product connects observation to judgment and judgment to action.
Visual trend or product improvement?
A visual trend changes how a dashboard looks. A product improvement changes how quickly and confidently someone can complete meaningful work.
Consider a SaaS retention dashboard.
Before: Twelve KPI cards, four trend charts, a segment table, and a generic AI chat button. Every module competes for attention.
**After: “Retention declined among annual self-service accounts after the billing release.” The interface presents affected segments, supporting evidence, uncertainty, and an “Investigate billing failures” action.
The second concept may still use cards, gradients, or a dark theme. Those choices are secondary. The material improvement is the relationship among change, evidence, significance, and action.
We apply the same distinction when using the principles of design as a practical interface evaluation framework. Hierarchy, proximity, contrast, consistency, and feedback should support workflow performance, not simply make a design review feel more polished.
- AI-native dashboards move beyond the chat bubble
An AI dashboard UI is not AI-native simply because it has a chatbot in the corner. If users still have to inspect an unchanged wall of KPIs, formulate questions from scratch, and verify every response elsewhere, the core experience has not evolved.
AI-native dashboard design puts intelligence inside the analysis and action loop. It can:
- Summarize significant changes.
- Explain anomalies in context.
- Suggest relevant follow-up questions.
- Assemble focused views for a task.
- Expose supporting records and assumptions.
- Help users complete controlled actions.
A product analytics dashboard, for example, should not merely announce that conversion declined. It should compare affected segments, mark relevant release dates, identify plausible contributors, and make the underlying events available for inspection.
A conversational dashboard can still include open-ended input, but conversation should not be the only interaction model. Suggested questions, contextual commands, and dynamically assembled views reduce the effort required to translate a visible problem into the right prompt.
Useful commands might include:
- “Compare this decline across acquisition channels.”
- “Show releases deployed before the change.”
- “List the most affected accounts.”
- “Create a saved view for this segment.”
- “Draft an investigation and assign an owner.”
Generated insights should shorten analysis without concealing the data. Our job is not to make AI sound authoritative. It is to show where an output came from, how uncertain it is, and how safely someone can use it.
Place AI where the decision happens
AI explanations belong beside anomalies, forecasts, affected records, and recommended actions. A separate blank chat panel forces users to carry context between the dashboard and the assistant.
Inline placement creates a clearer sequence:
- A meaningful change is highlighted.
- A concise explanation appears beside it.
- Supporting evidence is available on demand.
- Contextual follow-up questions narrow the investigation.
- A relevant action completes the workflow.
In a finance dashboard, an anomaly explanation might appear directly above the affected transactions. The module could identify the suspected cause, confidence, source data, assumptions, and any approval required before action.
This is also where generative UI becomes useful. Instead of permanently adding charts, the system can assemble a temporary comparison view around the current question. That view should remain inspectable, saveable, and consistent with the dashboard’s established navigation.
Make AI outputs explainable and reversible
AI output needs visible boundaries. A confident sentence without evidence does not create a trustworthy interface.
Depending on the decision, we recommend exposing:
- Data sources and covered periods.
- The time the analysis was generated.
- Confidence or uncertainty.
- Important assumptions.
- Missing or excluded information.
- An audit trail of generated and accepted actions.
- The distinction between correlation and confirmed cause.
Actions require further protection. A model may recommend pausing a campaign, revising a forecast, closing an incident, or contacting customers. The interface should preview the affected scope before execution.
Use confirmations, approval rules, undo states, and reversible drafts where consequences are meaningful. Our guide to generating AI interfaces that are actually shippable applies the same principle: speed matters only when product logic, constraints, states, and failure paths survive beyond the concept screen.
- Decision-centric layouts replace KPI walls
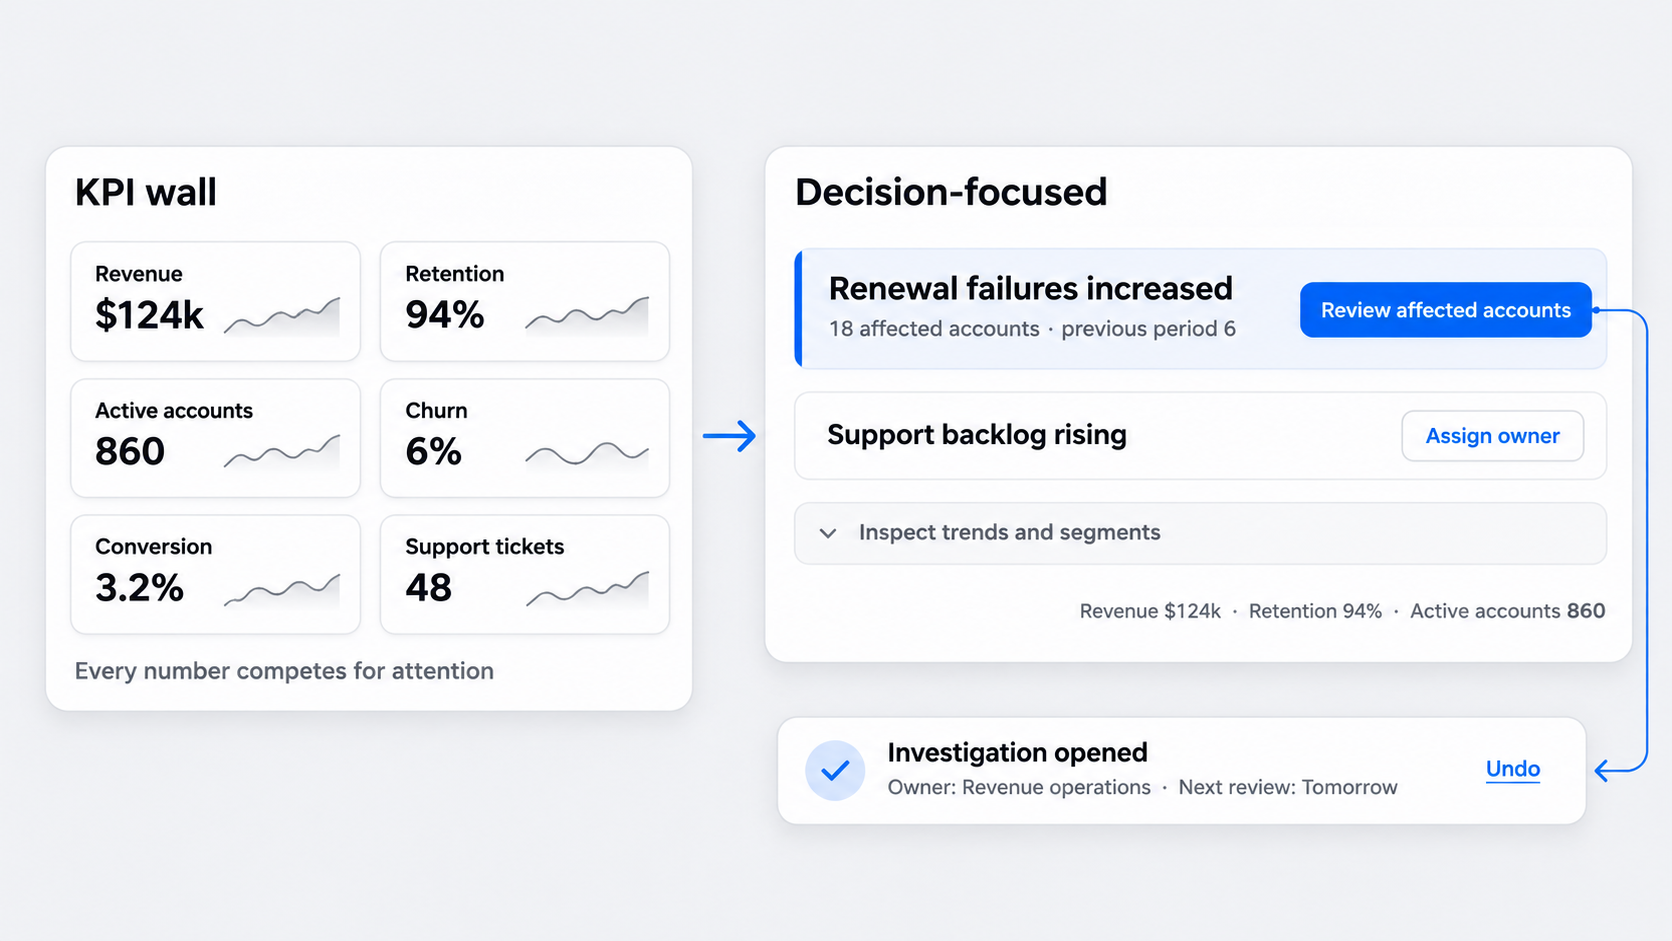 KPI walls organize information around what an organization can measure. Decision-centric dashboards organize it around what the user must decide.
That change reshapes the hierarchy. Instead of leading with revenue, retention, active users, churn, conversion, and support volume as equal cards, the dashboard might lead with a short list of prioritized changes requiring attention.
A useful primary module contains at least one of the following:
- A decision to make.
- An action to complete.
- An exception to resolve.
- An investigation to begin.
Normal-state metrics can remain available, but they should not compete with urgent work. A prioritized list often provides more value than a screen full of polished visualizations because it reduces the effort needed to find what matters.
Consider an executive dashboard.
Before: Every metric updates continuously, receives equal visual weight, and includes a miniature trend chart.
**After: The dashboard highlights material changes since the previous review, explains which goals are affected, and keeps stable metrics in a quieter summary.
This approach does not remove data. It establishes a clearer path from overview to evidence.
Design from the next action backward
Start with the decision, not the chart.
Ask:
- What decision must the user make?
- What evidence supports it?
- What action is available?
- What feedback confirms the outcome?
- What happens if the action fails or needs reversal?
For a retention problem, the action might be opening an investigation into failed renewals. Relevant evidence could include account segments, billing errors, release timing, and historical comparisons. The resulting state should confirm ownership, progress, and the next review point.
Action labels should describe outcomes. “Review affected accounts,” “Assign incident owner,” and “Approve revised forecast” are stronger than “View more,” “Manage,” or “Submit.”
This is the logic behind dashboard design that turns data into clear decisions: the interface should connect evidence to the next meaningful move rather than treating visualization as the endpoint.
Match hierarchy to urgency and impact
Equal-sized cards imply equal importance. That is rarely accurate.
Hierarchy should reflect some combination of:
- Severity.
- Business or user impact.
- Time sensitivity.
- Confidence.
- Scope.
- Ownership status.
A critical unresolved incident should dominate a stable weekly metric. A low-confidence forecast should look different from a confirmed threshold breach. An assigned issue already being resolved should not compete equally with an unowned exception.
Color alone cannot express these differences. Use labels, ordering, typography, grouping, status language, and persistent placement so priority remains clear in low-vision settings and monochrome exports.
- Progressive disclosure breaks the bento-grid habit
Bento grids have become a visual cliché. Modularity is useful, but repeating neat, equal-weight containers can destroy information hierarchy.
When every metric, chart, action, and status gets a decorative card, users must scan the entire layout to reconstruct relationships. Container styling consumes space while making priority harder to understand.
Progressive disclosure offers a stronger structure:
- Overview.
- Explanation.
- Evidence.
- Action.
The first layer should show whether attention is needed. Later layers can expose trends, segments, raw records, controls, and history as the task requires.
Useful patterns include:
- Expandable table rows.
- Side panels that preserve list context.
- Drill-down views with clear return paths.
- Inline evidence drawers.
- Contextual actions.
- Tabs within a focused investigation.
- Hover or focus details for supplementary values.
Cards remain appropriate when modules represent genuinely independent tasks. A billing approval queue and an infrastructure incident list may need separate containers because they have different owners and workflows. Several closely related retention metrics probably do not.
When bento grids fail
Bento dashboard design fails when the grid becomes the hierarchy.
Equal-sized modules force users to inspect everything because visual weight no longer communicates priority. Responsive rearrangement can worsen the problem if important modules move unpredictably across breakpoints.
Decorative containers also reduce useful density. Padding, borders, headings, and repeated controls take space that could show comparison values, ownership, evidence, or status.
A simple dashboard template is not automatically clear. Simplicity comes from reducing unnecessary decisions and organizing information coherently, not from placing less content inside larger cards.
A stronger layered pattern
An operations dashboard can begin with threshold breaches rather than the full metric inventory.
Default layer: Active exceptions, severity, affected services, owners, and elapsed time.
**Explanation layer: Likely cause, related events, and recent changes.
**Evidence layer: Logs, timelines, records, and historical comparisons.
**Action layer: Assign, acknowledge, escalate, remediate, or verify resolution.
This structure reduces all-at-once complexity without removing expert access. It also creates a logical responsive order: status and actions remain primary while detailed evidence moves into panels or dedicated views.
- High-density interfaces return—with better hierarchy
Minimalism does not always mean more whitespace, fewer controls, and oversized typography. In expert tools, that interpretation can become hostile.
Analysts, operators, finance teams, and security specialists often need compact tables, side-by-side comparisons, persistent context, keyboard access, and visible row-level actions. Forcing every task through spacious cards and separate detail pages slows comparison.
High-density dashboard UI works when it uses:
- Clear typographic levels.
- Consistent column alignment.
- Meaningful grouping.
- Sticky headers and landmarks.
- Restrained semantic color.
- Predictable row actions.
- Persistent filters and scope.
- Defined selected, focused, and expanded states.
A cybersecurity dashboard is a clear example. Analysts may need severity, asset, source, detection type, owner, status, and elapsed time visible together. Turning each event into an oversized card would increase scrolling and make comparison harder.
Density is not clutter
Clutter comes from weak hierarchy, inconsistent patterns, redundant controls, and unclear relationships. Density is the amount of useful information available in a given space.
Whitespace should separate meaning. It can distinguish groups, reinforce hierarchy, and prevent accidental interaction. It should not exist solely to make an enterprise interface look premium in a presentation.
A dense table can remain readable when columns align, labels are concise, priority signals are restrained, and details open without losing position. A spacious dashboard can still feel cluttered when every card uses a different chart, color, and control pattern.
Where workflows differ, offer comfortable, compact, and dense modes. Preserve the task hierarchy across modes rather than treating density as browser zoom.
Design for novice and expert speeds
New users need labels, guidance, explanations, and safe defaults. Frequent users need speed.
One dashboard can support both through layered capability:
- Keep actions labeled until their meaning is established.
- Add keyboard shortcuts for repeated tasks.
- Support batch selection and bulk actions.
- Allow saved filters and views.
- Preserve recently used scopes.
- Offer compact controls without removing accessible names.
- Keep destructive actions explicit and recoverable.
Static screens will not reveal whether these patterns work. Teams should use interactive prototypes to evaluate behavior, states, and transitions, including keyboard flow, expanded rows, loading, failures, and context restoration.
- Adaptive dashboards become user-governed
Adaptive dashboard design should improve relevance without making the interface unpredictable.
A dashboard may adapt by role, task, context, permission, selected goal, or current risk. A finance approver might see pending approvals first, while an analyst sees variance investigations. During an active incident, affected services can rise in priority.
Our guiding principle is straightforward: use controlled personalization, saved views, stable layouts, visible reasons, and manual overrides.
Adaptation should occur within recognizable boundaries. Navigation, search, scope, key actions, and major regions should remain stable even when modules or priorities change.
Helpful adaptation says, “This module moved up because it affects your selected goal.” Opaque automation silently rearranges the dashboard and leaves users wondering where familiar information went.
Keep navigation stable while relevance changes
Allow modules to reorder within bounded regions rather than rebuilding the entire interface. A priority region can surface active incidents while analysis, history, and configuration remain in expected locations.
Explain why content is prioritized. Possible reasons include:
- Assigned role.
- Active incident.
- Current account or workspace.
- Selected business goal.
- Saved preference.
- Permission change.
- Organizational default.
Visible reasons improve orientation and make incorrect adaptation easier to correct. They also help users distinguish personalization from a system-wide product change.
Give users control over personalization
Personalized dashboard UI should include direct controls such as:
- Pinned modules.
- Saved dashboard views.
- Editable defaults.
- Reset options.
- Manual density settings.
- Visible role and permission context.
- The ability to dismiss recommendations.
- Reversible system-applied changes where possible.
Saved views make personalization explicit. Someone can create an “Executive weekly review,” “Open security incidents,” or “Renewal risk” view instead of relying on the system to infer intent each time.
Predictability beats novelty. Users should be able to return to a known state, share a configuration, and understand which settings will persist.
- Proactive monitoring focuses attention on exceptions
Proactive dashboards shift attention from passive KPI monitoring to prioritized exceptions, anomalies, and emerging risks.
An alert merely says that something happened. An actionable exception explains what changed, why it matters, what is affected, who owns the response, and what should happen next.
That distinction prevents the dashboard from becoming another notification inbox. It also encourages teams to design the resolution workflow alongside the detection logic.
Normal-state summaries still matter. A message such as “All payment services within the expected range” can reassure users without demanding continuous inspection.
Design an actionable exception
A useful exception should state:
- What changed.
- Severity and urgency.
- Affected scope.
- Likely or confirmed cause.
- Supporting evidence.
- Recommended response.
- Current owner and status.
- Elapsed time.
- Resolution criteria.
“Checkout failures exceeded the operating threshold” becomes more useful when paired with affected regions, a preceding deployment, current incident ownership, and an action to inspect failed requests.
Verification matters too. Resolving an exception should not simply remove it. The dashboard should show whether the metric returned to range, how long stability must continue, and what evidence confirms recovery.
Reduce alert fatigue
More alerts do not create better awareness. They create competition for attention.
We reduce alert fatigue by:
- Grouping related events into one incident.
- Suppressing duplicates.
- Defining escalation paths.
- Supporting acknowledgement states.
- Muting known conditions temporarily.
- Separating informational changes from required actions.
- Allowing threshold adjustments within governed limits.
Organizational defaults should remain transparent. If someone changes a threshold, show the local value, the default, who can edit it, and how the change affects future alerts.
- Narrative visualization adds context, not decoration
Narrative data visualization connects a chart to the decision it supports. It adds comparisons, thresholds, annotations, and event context rather than decorative storytelling.
A conversion chart becomes more useful when it marks a release before a decline, compares affected segments, and shows the expected range. It may not need another chart.
Direct labels and meaningful reference points usually reduce interpretation effort. Legends, excessive chart variety, ornamental gradients, and gratuitous animation can make users decode the visualization before understanding the data.
Raw values and methodology should remain available. Narrative guidance should accelerate interpretation without preventing validation.
Build a useful chart narrative
A practical chart narrative has four parts:
- Establish the baseline.
- Highlight the meaningful change.
- Annotate relevant events.
- Connect the insight to an investigation or action.
Expected ranges, targets, previous periods, and peer comparisons are useful only when they inform the decision. Adding every possible reference creates visual noise.
For a product analytics dashboard, an annotation might state that conversion declined after a checkout release, with the largest change among mobile users. The dashboard can then offer segment comparisons, release details, and affected-session records.
The annotation provides a starting point. It should not present a plausible relationship as a confirmed cause.
Avoid manufactured certainty
Dashboards should distinguish among:
- Observed correlation.
- Model-generated inference.
- Analyst-confirmed cause.
- Unresolved explanation.
If data is incomplete, delayed, sampled, or excluded, disclose that where it affects interpretation. Confidence is not a decorative badge. It influences whether someone should investigate, wait, approve, or act.
Finance dashboards require particular care. An anomaly explanation should identify source data, assumptions, confidence, approval requirements, and a reversible next step. A strong narrative makes uncertainty actionable instead of hiding it.
- Calm real-time UX replaces constant motion
Real-time data often becomes product theater. If a metric changing this second will not alter the next decision, constant refreshing adds noise and implementation cost without improving the workflow.
Calm real-time dashboard design begins by defining freshness requirements for each metric. A service outage may require streaming updates, while an executive revenue view may need scheduled refreshes with a clear “updated at” label.
Every live dashboard should communicate:
- Last updated time.
- Expected refresh cadence.
- Connection status.
- Delayed or stale-data states.
- Whether values are final or provisional.
- The scope of the latest update.
Change highlighting, batched updates, and restrained transitions help users recognize movement without making the whole interface unstable.
Choose the right update model
Match the update model to decision urgency:
- Live streaming: Use when seconds materially affect the response, such as during an active infrastructure incident.
- Short polling: Use when near-real-time awareness matters but uninterrupted streaming is unnecessary.
- Scheduled refresh: Use for reporting cycles, executive reviews, and metrics that settle periodically.
- Manual refresh: Use when people need a stable analytical snapshot or data retrieval is costly.
Do not apply one cadence to the whole dashboard. Status, transactions, forecasts, and benchmarks may have different freshness needs.
Scheduled freshness can be more trustworthy than constant motion because users know which period they are evaluating. “Updated through 09:00 UTC” is clearer than counters that change without explaining whether the source data is complete.
Show change without stealing attention
When data updates, preserve scroll position, keyboard focus, expanded rows, selections, and active filters. A refresh should not interrupt the task.
Highlight meaningful deltas temporarily instead of animating every value. Batch related changes and provide a concise summary, such as “Several records updated; two now require review.”
Let users pause updates during analysis. If incoming data would change a comparison, reorder a table, or invalidate a selection, hold it until the user is ready and make the pending update visible.
Calm refresh behavior supports comprehension, accessibility, and trust. It also prevents teams from building high-frequency infrastructure when the underlying decision does not require it.
How to turn 2026 dashboard trends into a shippable concept
Trend awareness matters only when it produces a better product decision.
We recommend a five-step workflow:
- Define the user’s decision.
- Generate contrasting structural directions.
- Compare hierarchy and interaction patterns.
- Validate evidence, states, and constraints.
- Refine the strongest direction for production.
Generated concepts are useful for exploring alternatives quickly. They do not replace product judgment, realistic data, accessibility review, technical constraints, or user testing.
Instead of asking an AI dashboard generator for “a modern analytics dashboard,” specify the role, decision, evidence, urgency, actions, density, trust requirements, and responsive behavior. Better inputs produce concepts that can be assessed beyond surface polish.
A practical dashboard design prompt
Use this prompt structure:
Design a [dashboard type] for [role] who needs to decide [decision] using [data]. Prioritize [exceptions and actions], use [comfortable, compact, or dense] information density, explain [AI outputs and uncertainty], and preserve [stable navigation and controls]. Include [freshness, permissions, responsive constraints, accessibility needs, and recovery states].
For example:
Design a compact retention dashboard for a customer success director who needs to decide which renewal risks require intervention using account health, billing failures, product usage, and support history. Prioritize high-impact exceptions, explain AI-generated risk factors with sources and confidence, and preserve stable filters, saved views, and approval controls.
Generate at least three contrasting structures:
- Exception-led: Starts with prioritized risks and response paths.
- Workflow-led: Starts with tasks, ownership, and completion states.
- Analysis-led: Starts with comparisons, segmentation, and evidence.
The goal is not to produce three color themes. It is to compare fundamentally different ways of organizing the decision.
The ship-or-skip checklist
Score each concept against practical criteria.
Decision clarity
- Can users quickly find the highest-priority change?
- Is the next meaningful action clear?
- Does every primary module support a decision, action, or investigation?
Evidence and trust
- Do AI outputs expose sources, assumptions, timestamps, and uncertainty?
- Can users inspect underlying records?
- Are correlation, inference, and confirmed cause clearly distinguished?
Control
- Are consequential actions previewed and reversible?
- Can users manage saved views, density, and personalization?
- Are adaptive changes visible and predictable?
Monitoring
- Does each exception include impact, owner, status, and a response path?
- Are alerts grouped and prioritized?
- Are normal states reassuring without demanding attention?
Realistic use
- Does the layout work with production-scale data?
- Can experts compare records efficiently?
- Are keyboard access, focus, contrast, and responsive behavior addressed?
- Do refreshes preserve context and selection?
A polished concept that fails these checks should not ship. Surface quality cannot compensate for weak decision support.
Describe, design & ship with UXMagic
UXMagic helps teams generate dashboard concepts from structured prompts, compare their hierarchy, and refine the strongest direction before investing in production details.
The AI UI Generator for Figma-ready designs works best as an exploration tool. Teams can test exception-led, workflow-led, and analysis-led directions, then apply product, engineering, data, and accessibility constraints. We can describe, design, and ship faster while keeping human judgment in the loop.
Build a dashboard direction worth shipping
Turn a defined decision, realistic data requirements, and clear interaction constraints into multiple Figma-ready concepts with uxmagic.ai. Explore the alternatives, challenge the hierarchy, and ship the direction that helps users act—not merely admire the dashboard.